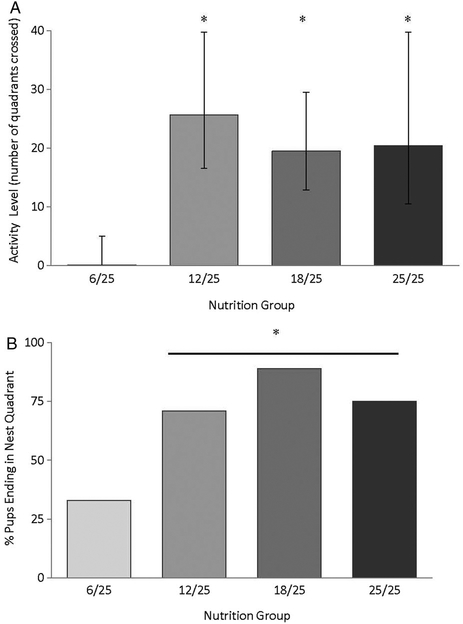
Figure 3.
(A) Pup activity levels (quadrants crossed per3 minute) on PND 13 by nutrition group. On PND 13, the 6/25 pups were significantly less active relative to pups from all other nutrition groups (* vs. 6/25, P < 0.05). (B) Percentage of pups with a diagonal start position that ended in the nest quadrant on PND 13 by nutrition group. Pups from the 6/25 group had reduced homing success relative to pups from all other nutrition groups (Fisher’s exact test, P < 0.05).

