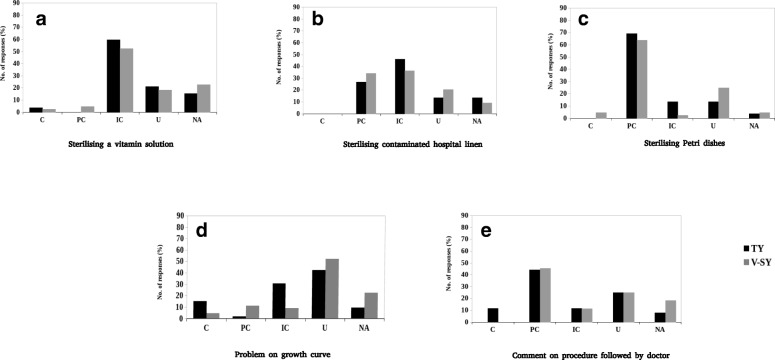
Fig. 3.
Percentage of student responses in each category for the three questions identified by their keywords: a–c are subparts of the “easy” question. d "moderate" question, e "difficult" question. The x-axis represents categories of student responses. C Correct; PC Partially Correct; IC Incorrect; U Unrelated; NA Not Attempted; TY Third-year students from college V; V-SY Second-year students from college V

