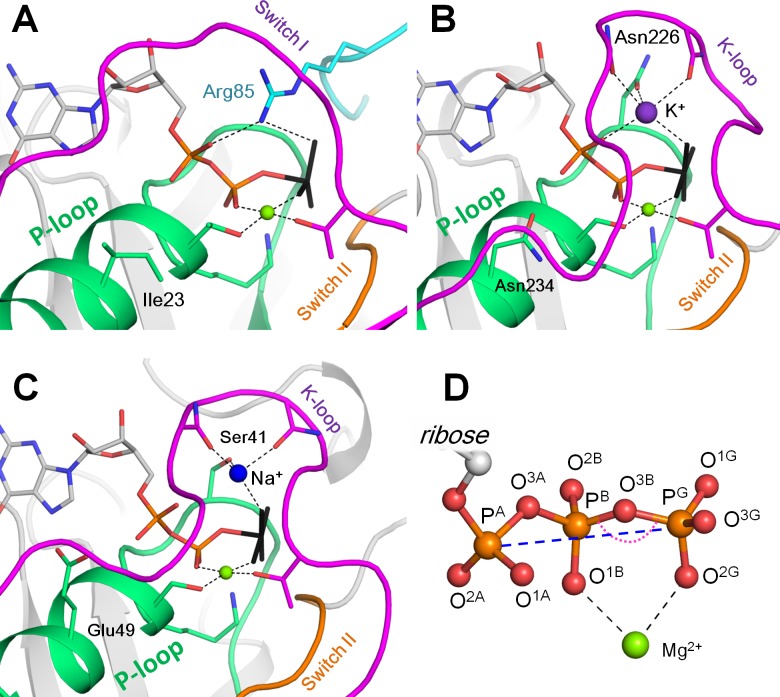
Figure 1. Mg-NTP complexes and their binding in the active sites of P-loop NTPases.
Phosphate chains of NTP molecules and their analogs are colored by atoms: oxygen atoms in red, phosphorus in orange. The K+ ion is shown as a purple sphere, Na+ ion is shown as a blue sphere, Mg2+ ions are shown as green spheres. Phosphate chain is shown in stick representation with oxygens in red and phosphorus atoms in orange; γ-phosphate mimicking groups (AlF4- and MgF3-) are shown in black, coordination and hydrogen bonds are shown as black dashed lines. (A) Active site of the small Ras-like GTPase RhoA in complex with the activating protein RhoGAP [PDB entry 1OW3]; the bound GDP-MgF3- mimics the transition state. The P-loop with the preceding α-helix is shown as green cartoon; Switch I motif with the conserved Mg2+-binding Thr residue is shown in magenta; Switch II motif (DxxG motif, which starts from the conserved Asp of the Walker B motif) is shown in orange; the Arg finger of RhoGAP is colored turquoise. (B) Active site of the K+-dependent GTPase MnmE with bound GDP-AlF4- [PDB: 2GJ8]. Switch I region and the K-loop are shown in magenta. (C) The active site of dynamin, a Na+-adapted GTPase with bound GDP-AlF4- [PDB: 2X2E]. The P-loop and K-loop (Switch I region) are colored as in panels A and B. (D) Structure of the NTP triphosphate chain with Mg2+ ion in a bidentate coordination, referred to as the βγ conformation. The pink dotted arch indicates the PB-O3B-PG angle; the blue dashed line indicates the PA-PG distance. The atom names are in accordance with the CHARMM naming scheme (Vanommeslaeghe et al., 2010) and the recent IUPAC recommendations (Blackburn et al., 2017).

