. 2018 Dec 11;7:e37373. doi: 10.7554/eLife.37373

Figure 2. Binding of monovalent cations to the Mg-ATP in water.

The color scheme is as in Figure 1. (A) Superposition of the ATP phosphate chain conformations observed in the MD simulations in the presence of K+ ions (shown in purple); Na+ ions (shown in blue) and NH4+ ions (nitrogen atoms of NH4+ ions are shown in yellow/green). The ribose and adenine moieties are not shown, the phosphate chain is shown with PA on top and PG at the bottom. All cations within 5 Å from the phosphate chain are shown and colored in different shades depending on the nearby oxygen atoms to illustrate the distinction between binding in the AG and BG sites (see text for details). Transparent spheres signify the ions outside the AG and BG sites. The constellation of ions in the vicinity of γ-phosphate is referred to as the site G. For the visualization, we have selected every 100th simulation frame to sample the conformational states of the Mg-ATP complex with 5-ns intervals. The conformations were superposed to achieve the best possible match between coordinates of the phosphorus and ester oxygen atoms of the ATP phosphate chain. (B) Geometry of the Mg-ATP complex with two monovalent cations bound, one in the AG site and one in the BG site. Distances to the AG and BG binding sites (RAG and RBG) were calculated as averages of the distances to the two corresponding oxygen atoms. The distances to the oxygen atoms (e.g. rA) were defined as the shortest distances between a particular M+ ion and any oxygen atom of the respective phosphate group (including the bridging oxygen atoms). (C-E) distance distributions for K+, NH4+, and Na+ ions in the AG and BG sites.

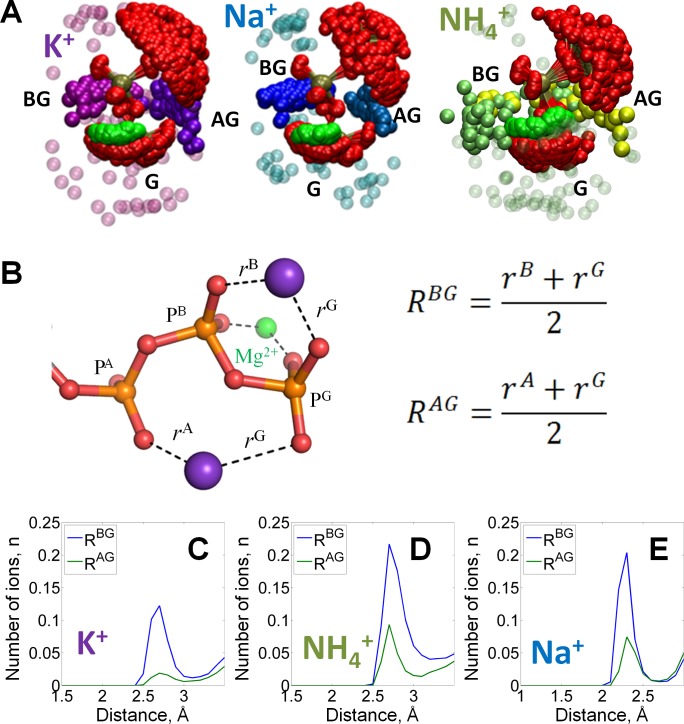
Figure 2.

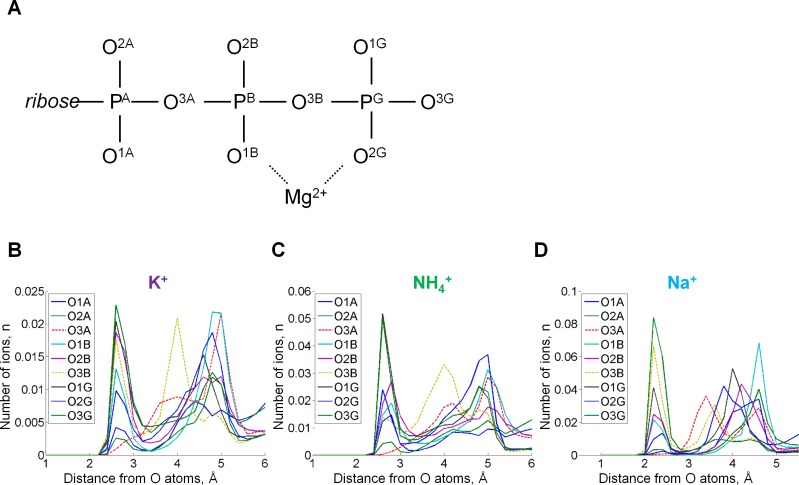
Figure 2—figure supplement 1. Radial distribution of cations in the proximity of each oxygen atom.

Figure 2—figure supplement 1.

Radial distributions are shown for all atoms of the ATP phosphate chain. (A) Atom names are in accordance with the CHARMM naming scheme (Vanommeslaeghe et al., 2010) and the recent IUPAC recommendations (Blackburn et al., 2017). (B) Radial distributions of cations around individual oxygen atoms. The distributions of cations around ester bond oxygen atoms O3A and O3B are shown by dashed lines. The peak distances from the cation to the oxygen atoms were the same 2.7 Å for K+ and NH4+ ions, while for Na+ this distance was 2.2 Å. For the NH4+ ion, the distance was measured from each oxygen atom to the nitrogen atom of NH4+. There are two ester bond oxygens in the phosphate chain, but only the oxygen (O3B) that connects β- and γ-phosphates was seen involved in the cation binding, it interacted more often with K+ and Na+ than with NH4+. Monovalent cations were found near oxygen atoms of γ-phosphate more often than near oxygens of β- and α-phosphates.
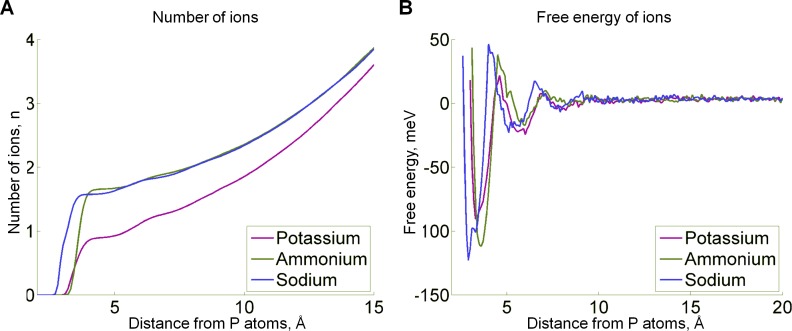
Figure 2—figure supplement 2. Properties of cation binding to the ATP as derived from MD simulations.

Figure 2—figure supplement 2.

(A) Probability distribution functions for cations around the phosphate chain. We have plotted the number of atoms inside the area centered on phosphorus atoms of the ATP phosphate chain as a function of the radius of the selected area. This number was estimated by measuring the distance between each cation in the system and the nearest phosphorus atom of ATP during MD simulations. The plot indicates the presence of 1.5 cations on average in the 4 Å radius around the phosphate chain in the case of Na+ and NH4+, and 0.75 ions on average in the case of K+. For all three ions, the first inflection occurs at the distances shorter than 4 Å and a less prominent second inflection can be seen at around 6 Å. (B) Free energy of the cation binding as a function of the distance from the phosphate chain, as estimated from the probability data in panel A. In addition to the two binding sites at the distances of approx. 4 Å and 6 Å, the free energy plot revealed a less pronounced third binding site at a distance of approx. 8–9 Å from the phosphorus atoms. The most prominent is the first peak, corresponding to cation binding around the phosphate chain, within the 4 Å distance of at least one of the phosphorus atoms, so further focus was specifically on cation binding around the phosphate chain.
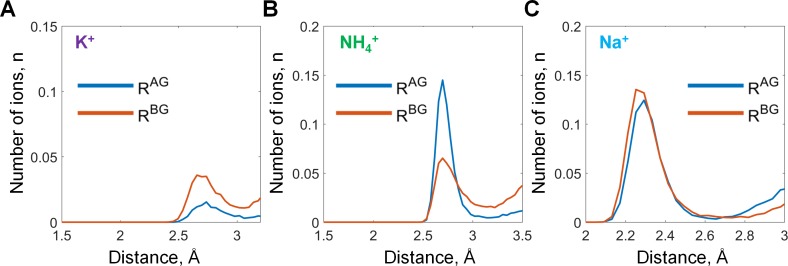
Figure 2—figure supplement 3. Binding of monovalent cations to the Mg-GTP in water.

Figure 2—figure supplement 3.

Distances to the AG and BG binding sites (RAG and RBG) were calculated as averages of the distances to the two corresponding oxygen atoms (see Figure 2 in the main text). The distances to the oxygen atoms (e.g. rA) were defined as the shortest distances between a particular M+ ion and any oxygen atom of the respective phosphate group (including ester oxygen atoms). (A-C) distance distributions for K+, NH4+, and Na+ ions in the AG and BG sites.