
Figure 4. Dynamics of the phosphate chain of the Mg-ATP complex with and without monovalent cations.
Each left panel shows the PA-PG distance (upper trace) and the PB-O3B-PG angle (bottom trace) in the course of MD simulations. Thin gray lines show actual values measured from each frame of the MD simulation, the bold black lines show moving average with a 2-ps window. Black boxes indicate fragments of simulations chosen for the analyses of particular types of interaction between the Mg2+ ion and the triphosphate chain; the respective conformations of Mg-ATP are shown on the right. The analysis was performed as shown in Figure 2B. The color scheme is as in Figure 1. (A) no added ions; (B–D) MD simulations in the presence of K+, Na+, and NH4+, respectively.

Figure 4—figure supplement 1. Coordination of the Mg22+ion by the oxygen atoms of the ATP phosphate chain during MD simulations.

Black vertical lines indicate borders between independent simulations, thick colored lines show moving averages of distances measured during MD simulations. Oxygen atoms are labeled as in Figure 1D. The most populated conformation in each of the four systems is characterized by the Mg2+ ion coordinated by three oxygen atoms: one of the free oxygens of the α-phosphate (O1A or O2A), O3B atom, and an oxygen atom from the γ-phosphate (O1G, O2G, or O3G). This conformation resembles the αβγ conformation of the Mg-ATP complex seen in other studies but differs in the inclusion of an ester oxygen atom in the Mg2+ coordination sphere.
Figure 4—figure supplement 2. Estimation of correlation times for the PA-PG distances.
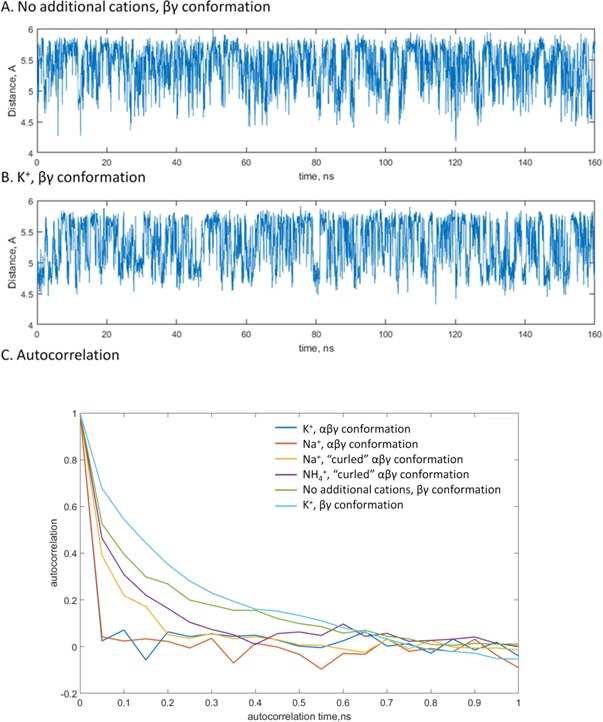
A,B, Changes of the distance value upon MD simulations of βγ-coordinated Mg-ATP complexes with no additional monovalent cations (A) and with K+ ions (B) provided as examples. (C) Autocorrelation values plotted as functions of the time lag. Based on this plot, the correlation time of 1 ns of simulation time was anticipated for the all types of interactions between the Mg2+ ion and the triphosphate chain and in the presence of all tested M+ ions.
Figure 4—figure supplement 3. Estimation of correlation times for the PB-O-PG angles.
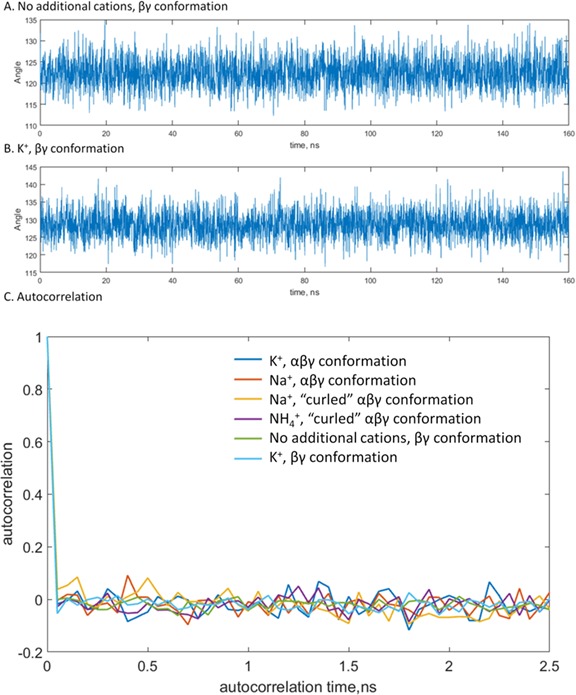
A, B, Changes of the angle value upon MD simulations of βγ-coordinated Mg-ATP complexes with no additional monovalent cations (A) and with K+ ions (B) provided as examples. (C) Autocorrelation values plotted as functions of the time lag. Compared to the distance measurements, the angle values oscillated on a much shorter timescale and accordingly had shorter correlation times. From this plot, the correlation time of 5 frames or 250 ps of simulation time was estimated. The general shape of the autocorrelation function was the same for all types of interactions between the Mg2+ ion and the triphosphate chain and in the presence of all tested M+ ions.