. 2018 Dec 11;7:e37373. doi: 10.7554/eLife.37373

Figure 6. Location of positive charges around the phosphate chain of Mg-NTP complexes in solution and in protein structures.

The color scheme is as in Figure 1; dark blue spheres indicate positions of positively charged side-chain nitrogen atoms of Lys and Arg residues, P-loop regions are shown as cartoons in grey. (A) Superposition of phosphate chain conformations observed in MD simulations with K+ ions. Only conformations with βγ coordination of Mg2+ are shown. (B) Superposition of P-loop regions of crystal structures of cation-dependent P-loop NTPases: GTPase MnmE [PDB: 2GJ8], Fe transporter FeoB [PDB: 3SS8], dynamin-like protein [PDB: 2X2E], and translation factor eIF-B5 [PDB: 4TMZ], see Table 3 for details. (C) Superposition of P-loop regions of crystal structures of cation-independent P-loop NTPases: Ras/RasGAP complex [PDB: 1WQ1], septin [PDB: 3FTQ], atlastin [PDB: 4IDQ], Gα12 protein [PDB: 1ZCA], DNA polymerase III subunit τ [PDB: 3GLF], F1-ATPase [PDB: 2JDI].

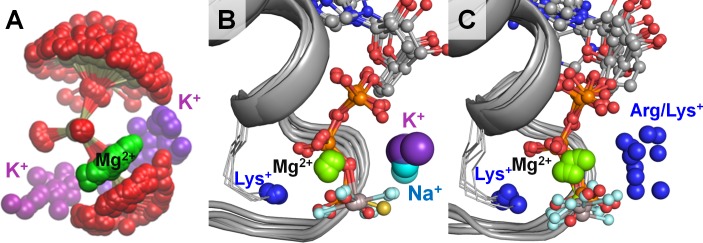
Figure 6.

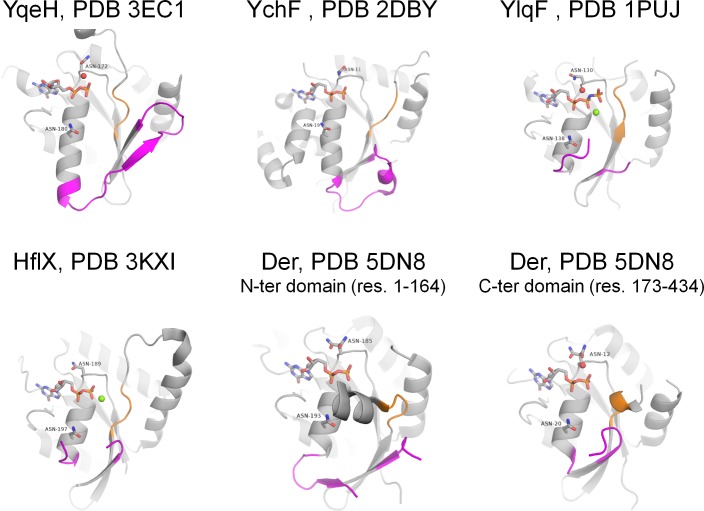
Figure 6—figure supplement 1. Active sites of P-loop NTPases with established K+-dependent activity (see Supplementary file 1A for the full list and references).

Figure 6—figure supplement 1.

Each of the proteins shown has both Asn residues that were shown to be associated with binding of monovalent cations in related proteins (Ash et al., 2012). Switch I, including the K-loop, and its flanking regions are shown in magenta, switch II motif DxxG is shown in orange. NTP-like molecules are shown as sticks, Mg2+ ions are shown as green spheres, water molecules in the area of supposed cation binding are shown as red spheres.
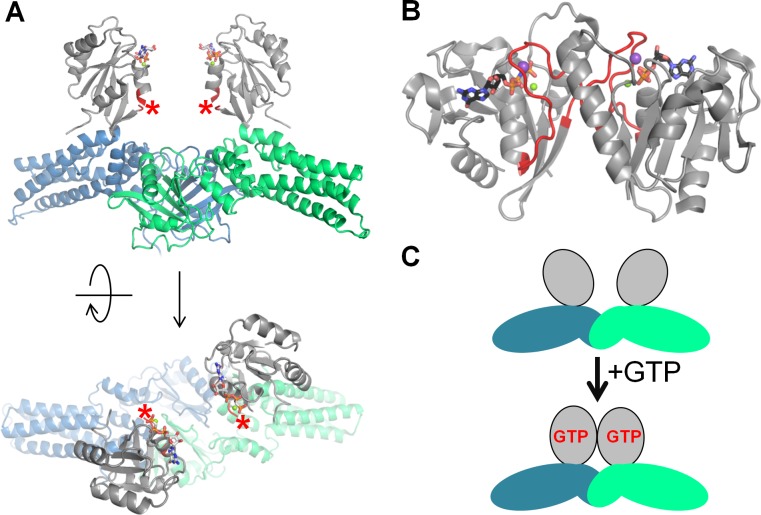
Figure 6—figure supplement 2. Activation of the MnmE GTPase upon dimerization.

Figure 6—figure supplement 2.

(A) Inactive dimer of the full-length MnmE in the GTP-bound form (the structure (PDB: 3GEI) was resolved with non-hydrolyzable GTP analogs). The P-loop domain is shown in grey, the K-loop is not resolved (its position is indicated by red asterisks), the N-terminal and helical domains are shown in blue and green for different monomers. (B) An active dimer of isolated G-domains of MnmE, as resolved in complex with a transition state analog and K+ ion (PDB: 2GJ8). The K-loops are shown in red, K+ ions are shown as purple spheres. (C) Schematic representation of the conformational changes in MnmE dimers, reproduced after (Klare, 2013), domains are colored the same way as on panel A.
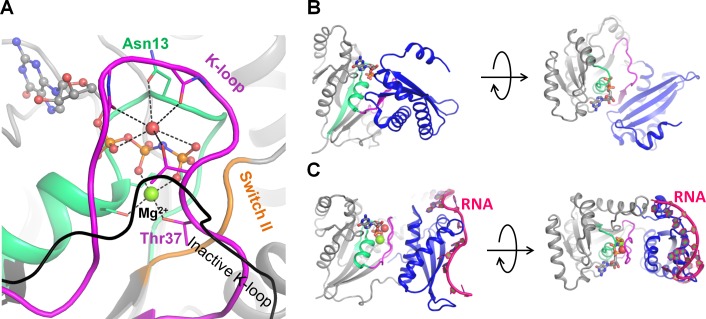
Figure 6—figure supplement 3. Activation of the GTPase Era upon RNA binding.

Figure 6—figure supplement 3.

(A) Inactive Era in the GDP-bound form [PDB: 3IEU] (Tu et al., 2009) in two projections. (B) Active Era in complex with nucleotides 1506–1542 of 16S rRNA and a non-hydrolyzable analog of GTP [PDB: 3R9W] (Tu et al., 2011) in two projections. (C) Cation-binding site of active Era, occupied by a water molecule (shown as a red sphere) [PDB: 3R9W] (Tu et al., 2011). The black line indicates, for comparison, the position of the K-loop in the inactive structure [PDB: 3IEU] (Tu et al., 2009). The P-loop domain is shown in grey, the P-loop region shown in green, the K-loop region shown in magenta, nucleotide analogs are shown as sticks, Mg2+ ions are shown as green spheres.
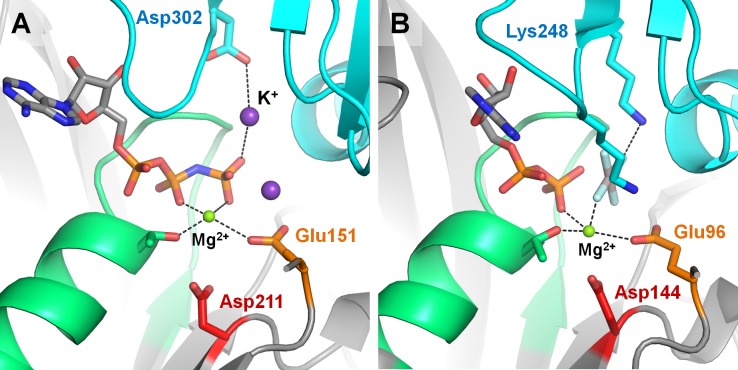
Figure 6—figure supplement 4. Positively charged moieties in the active site of RecA-like recombinases.

Figure 6—figure supplement 4.

(A) Cation-dependent RadA recombinase from Methanococcus voltae [PDB: 2F1H] (Qian et al., 2006). (B) Cation-independent RecA recombinase from E. coli [PDB: 3CMX] (Chen et al., 2008). The protein structure is shown as grey cartoon, the adjacent monomer is shown in blue, the P-loop region is shown in green; catalytic Glu residues are shown as orange sticks, conserved Asp residues of the Walker B motif are shown as red sticks. Functionally relevant residues from adjacent monomers are shown as blue sticks. Mg2+ ions are shown as green spheres, K+ ions as purple spheres.