. 2018 Dec 12;7:e42150. doi: 10.7554/eLife.42150

Figure 3. Interaction of RGS7 with Gβ5.

(a) Cartoon representation of the superposed Gβ5 structures from RGS7 with RGS9 and Gβ1. The differences between the loop regions are highlighted in red boxes. The N-terminal α-helix of Gβ5 from RGS7 also shows variation compared to Gβ5 from the RGS9 complex and Gβ1 from the Gαβγ complex. (b) Surface representation of Gβ5 top face (grey) highlighting the RGS7 contact residues (red). Two contact interfaces that are formed by the DHEX-GGL linker and the DEP domain are shown as a carton in green and pink, respectively. (c) The hotspot region (green) mapped onto the Gβ5 surface based on contacts formed by known Gβ1 binding partners. RGS7 (red) overlaps with the hotspot footprint. The DEP domain forms a unique contact surface on the top face of Gβ5. (d) Distinct interacting residues of the DEP domain of RGS7 (pink) that forms direct contacts with Gβ5 (cyan) are shown along with equivalent residues of RGS9. A unique electrostatic interaction is formed by Dα1 residue R33 of the RGS7 DEP domain with E280. Its organizational equivalent in RGS9 is formed by interactions with R62 from α-helix Dα2. The Dα2-Dα3 loop of the DEP domain that is involved in interactions with Gβ5 has a different organization in RGS7 and RGS9 and is indicated by an arrow.

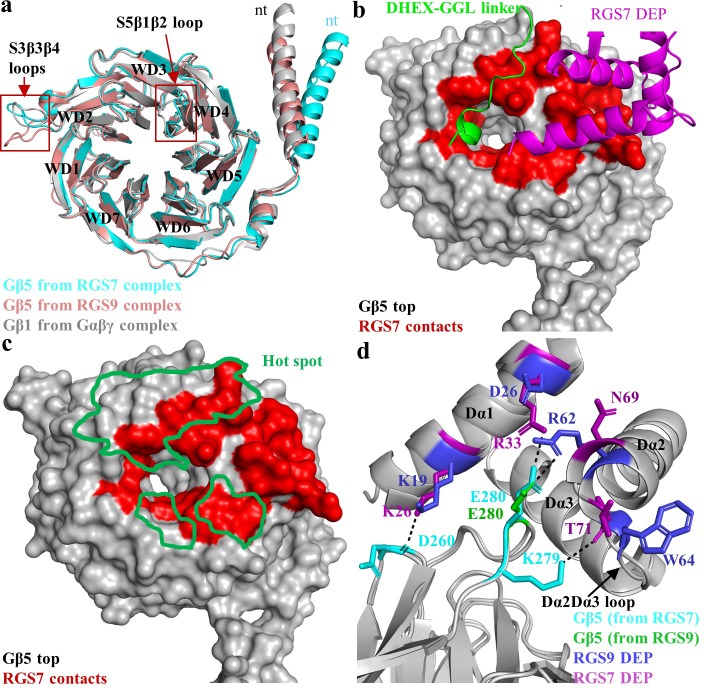
Figure 3.

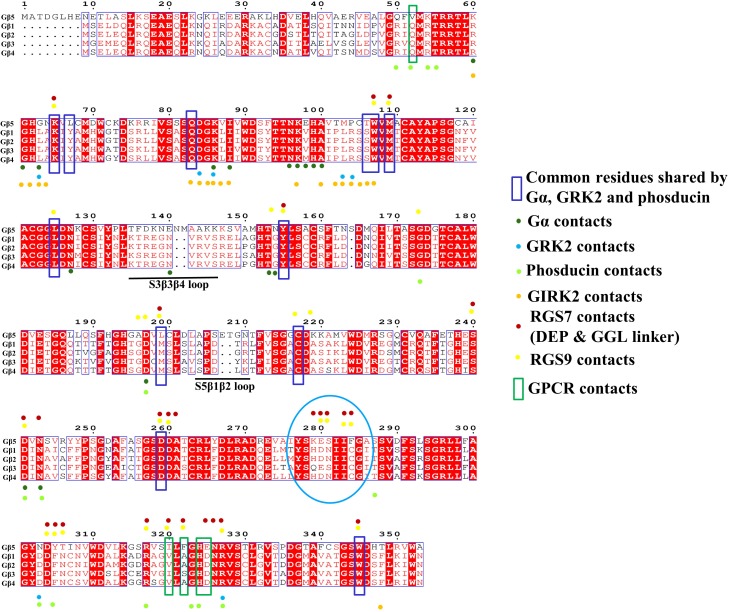
Figure 3—figure supplement 1. Gβ subunit sequence alignments and contact residues with effector molecules.

Figure 3—figure supplement 1.

Multiple sequence alignments of the Gβ subunits. The residues in contact with the Gβ subunits with the effector molecules are plotted and shown as colored spots. Common residues in contact referred to as hotspot regions are conserved among all Gβ subunits and are shown in a blue box. GPCR contact residues are shown in a green box. The unique contacts formed by the DEP domain of RGS7 and RGS9 are shown in the cyan circle. The unique two loops specific to Gβ5 with two amino acids insertions are underlined.
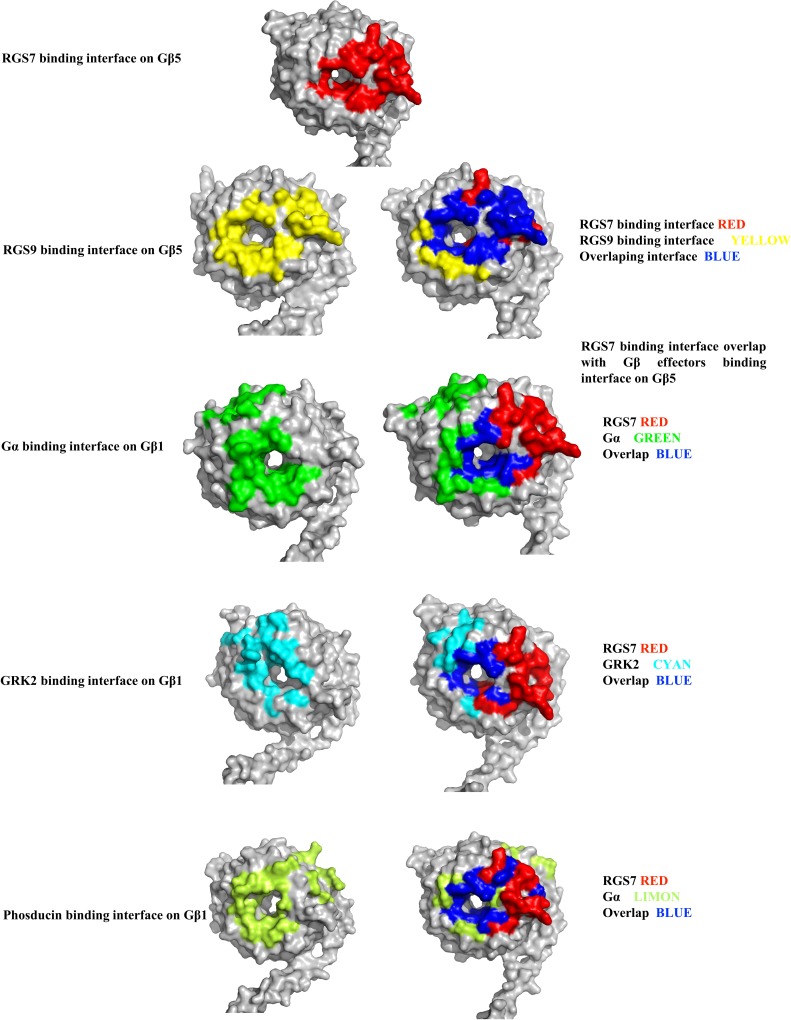
Figure 3—figure supplement 2. Comparison of binding interfaces of various effector molecules of the Gβ subunits with RGS7-Gβ5 by mapping the overlap onto the Gβ5 surface.

Figure 3—figure supplement 2.

The contacts between the Gβγ effector molecule complexes are compared and mapped onto the Gβ subunits. The effector molecule contacts are mapped onto the Gβ subunits surface and shown in left and are mapped onto the Gβ5 subunits along with the RGS7 contacts in the right panel. The overlap between the interfaces are colored in blue. The β subunit were taken from respective complex structure of RGS9-Gβ5 (PDB entry 2pbi), Gαβγ trimer complex (PDB entry 1gp2), GRK2-Gβγ complex (PDB entry 1omw), and phosducin-Gβγ complex (PDB entry 1b9y).
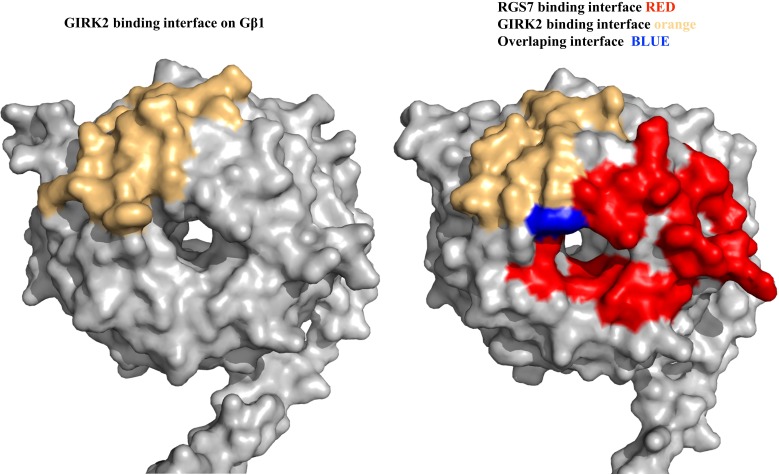
Figure 3—figure supplement 3. Comparison of the binding interfaces of RGS7 with GIRK2 of the Gβ subunits.

Figure 3—figure supplement 3.

GIRK2 and RGS7 are in contact with the Gβ subunit. Left, GIRK2 is in contact with the Gβ1 subunit from the GIRK2-Gβ1γ2 complex (PDB entry 4kfm) and mapped onto the Gβ1 surface. Right, the GIRK2 and RGS7 contacts are mapped onto the Gβ5 surface and the overlap is shown in blue.
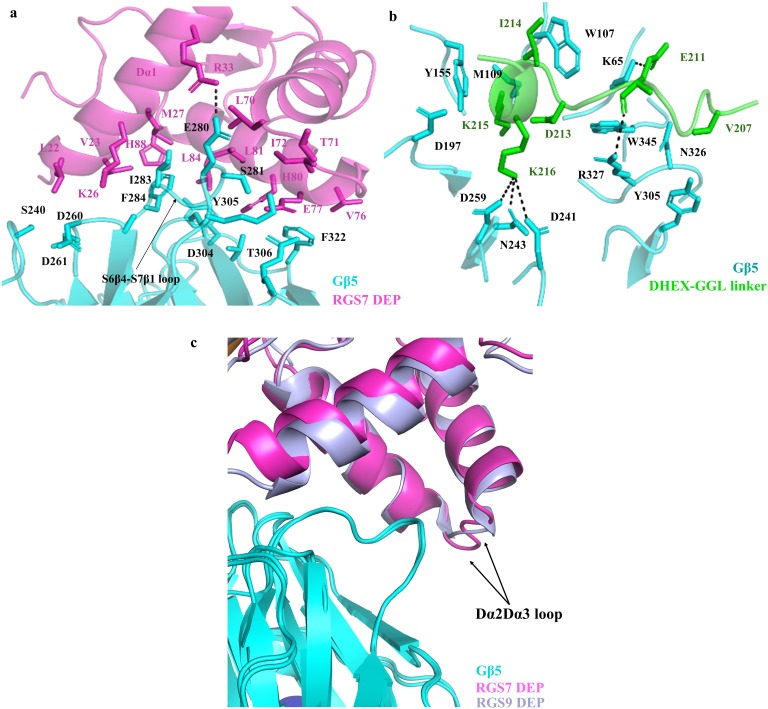
Figure 3—figure supplement 4. Interaction of RGS7 with the Gβ5 subunit.

Figure 3—figure supplement 4.

Detailed view of the interface formed by Gβ5 with residues of (a) the DEP domain and (b) the DHEX-GGL linker, represented as a cartoon. Hydrogen bonds are shown in black dotted lines. (c) Cartoon representation of the superposed DEP domains of RGS7 (pink) and RGS9 (light blue) interfaced with Gβ5. The different organization of the Dα2-Dα3 loop of the DEP domains is shown by an arrow.