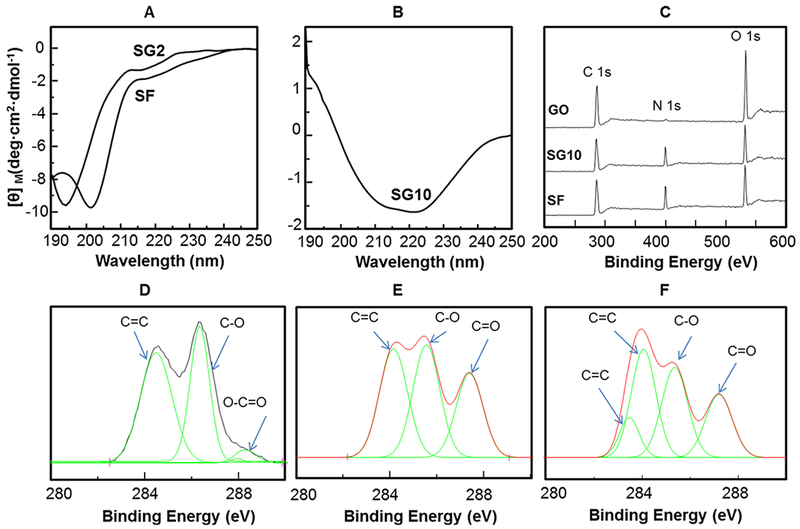
Figure 2.

Structural changes of SF molecules and GO templates in the one-pot reaction solutions. (A,B) CD spectra of SG2 and SF (A) and SG10 (B). (C–F) XPS spectra of GO, SG10, and SF. CD spectra proved that the secondary structure of SF can be controlled by changing the GO content. XPS spectra show almost no nitrogen in the GO solution and the SG10 had an emerging N peak because of the contribution of the amino acids from SF. The high-resolution C 1s spectra of GO (D), SG10 (E), and SF (F) show that GO was reduced by SF molecules in SG10 solution.
