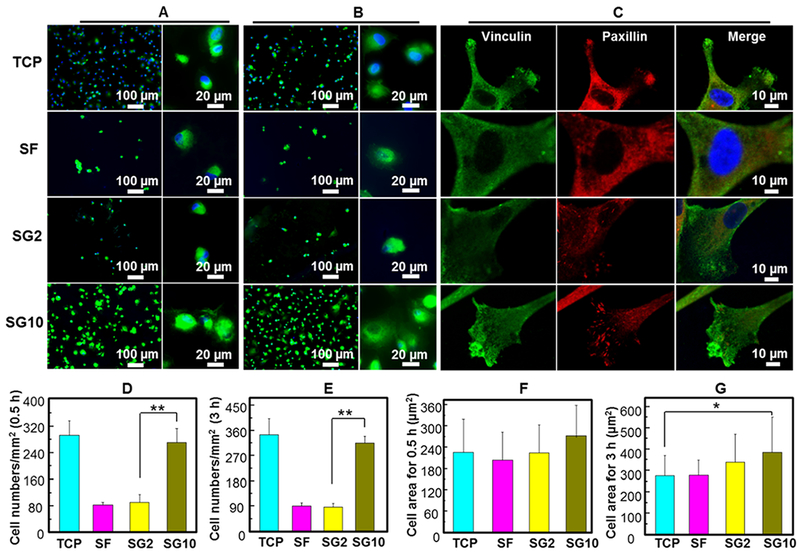
Figure 6.

Evaluation of cell adhesion effect and expression of adhesion-associated proteins seeded on the SF/GO films. (A,B) Adhesion morphology of MSCs on TCP, SF film, SG2 film, and SG10 film for 0.5 (A) and 3 h (B). (C) Immunofluorescence staining of two adhesion-associated proteins including vinculin and paxillin. (D,E) Quantitative analysis of cell numbers in (A,B), respectively. (F,G) Quantitative analysis of each cell adhesion area in (A,B), respectively. **P < 0.01, data are presented as mean ± SD, n = 5.
