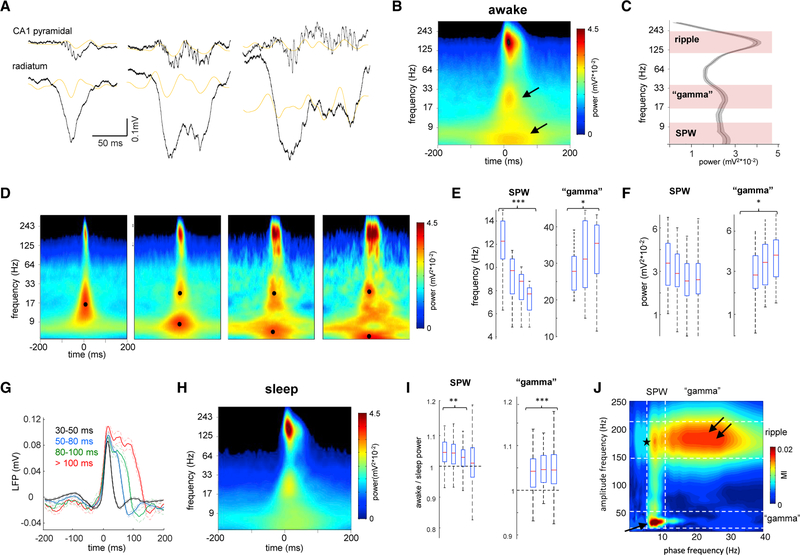
Figure 1. Nature of Different Spectral Components of SPW-R Complexes.
(A) Examples of different length SWP-Rs. Wide-band (1 Hz to 20 kHz) LFP traces from the CA1 pyramidal layer and str. radiatum. Orange traces are 20–50 Hz filtered LFPs. Gray traces are power envelope in the 100–300 Hz band.
(B) Average peri-SPW-R wavelet spectrogram (n = 12 animals) during waking immobility. In addition to the ripple (~150 Hz), two other spectral components appear in lower-frequency bands, one around ~30 Hz and other below 10 Hz (arrows).
(C) Derivative of peri-SPW-R wavelet spectrogram at the SPW-R peak from 5 to 300 Hz identifies three spectral peaks: 120–250 Hz (ripple band), 17–40 Hz (gamma band), and 5–15 Hz (sharp-wave band).
(D) Average spectrograms of all SPW-R events detected during waking immobility (54 sessions in 12 rats) divided according to their durations: 30–50, 50–80, 80–100, and 100–300 ms. Note that spectrograms for the shorter events display only two frequency components, while for longer ones the slow frequency activity is segregated in two separate components. Black dots correspond to the maximal power in the “gamma” and SPW bands.
(E and F) Distribution of the (E) mean frequency and (F) power for the SPW and “gamma” bands for events of different duration. Shorter events only have SPW, no “gamma” component. *p < 0.05, ***p < 0.001, post hoc Tukey’s test for all SPW-R events in the different duration categories.
(G) Wide-band peri-SPW-R pyramidal layer LFP averages for events of different duration. Note the presence of two or three “bumps” for longer events.
(H) Average peri-SPW-R wavelet spectrogram (n = 54 sessions in 12 animals) during non-REM sleep.
(I) Ratio of awake versus sleep power of SPW and gamma bands for events of different duration. **p < 0.01, ***p < 0.001, signed rank test.
(J) Averaged phase-amplitude comodulogram for CA1 pyramidal layer LFP revealed cross-frequency coupling between SPW phase and “gamma” (arrow) and ripple amplitudes (double arrow), and between “gamma” phase and ripple amplitude (star).

