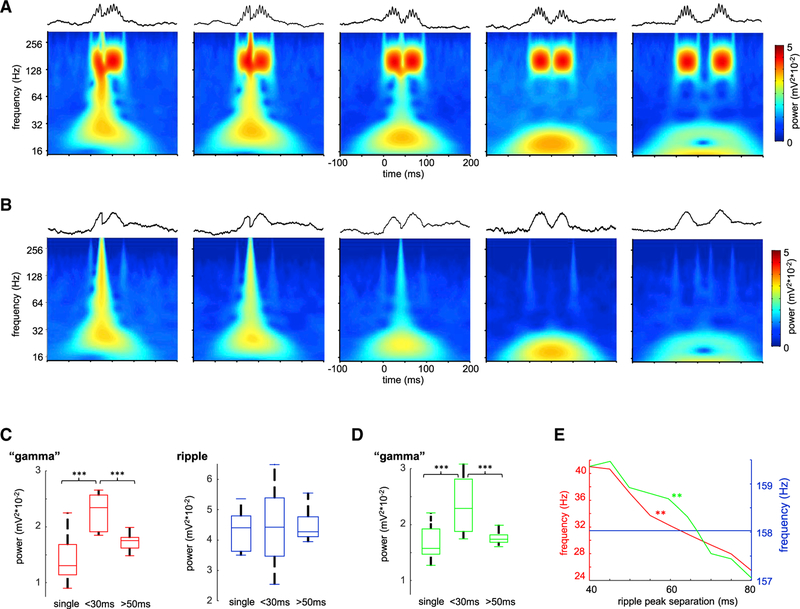
Figure 3. Synthetic Ripple Pairs Induce Slow Gamma Power.
(A) Average wavelet spectrograms for synthetic ripple pairs with progressively longer inter-ripple interval. Note emerging “gamma” band with concatenated ripple doublets. Upper traces illustrate examples of simulated ripples.
(B) Same as in (A), but in this case similar events were simulated but without the high-frequency “ripple” component, i.e., only the slow envelope. Note that in this case similar slow gamma band power appeared.
(C) Power in the “gamma” and ripple bands for single pulses and double pulses of <30 and >50 ms separation. ***p < 0.001, rank sum test.
(D) Same as in (C) but for events without ripple component. ***p < 0.001, rank sum test.
(E) Frequency in the “gamma” (red and green curves for events with and without ripple oscillation respectively), but not in the ripple (blue), band was correlated with pulse separation (**p < 0.01, Student’s t test).

