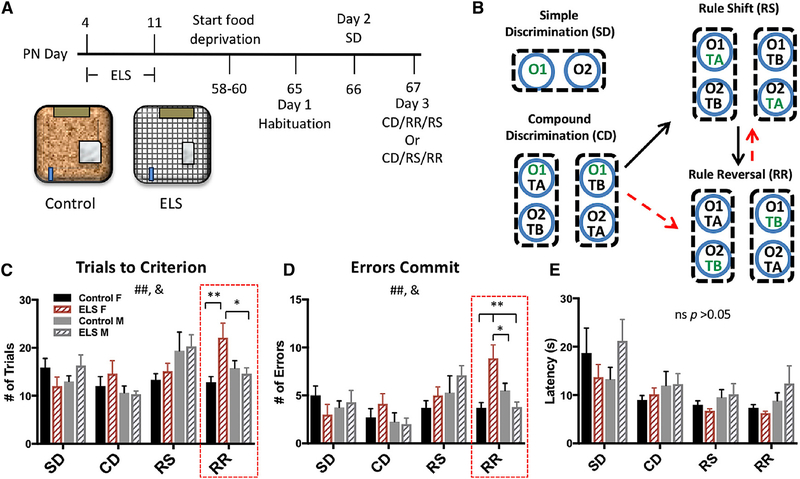
Figure 1. Females Exposed to ELS Demonstrated Significant Impairments in Rule-Reversal Learning.
(A) Timeline for ELS and behavioral testing. Schematic of control and ELS conditions from PN days 4–11. Control animals remain in their home cage with ample bedding, while ELS dam and pups are transferred into the ELS cage.
(B) Schematic of the attentional set-shifting task (black arrows, top) in which animals perform a simple discrimination (SD), followed by a compound discrimination (CD), a rule shift (RS), and a rule reversal (RR). The schematic with red arrows (bottom) shows that half of the mice underwent testing in a counterbalanced order, with RR preceding RS. Green text indicates the rewarded stimulus.
(C) A significant difference in the number of trials to reach criterion between task phases (repeated measure [RM] ANOVA; F(3,34) = 5.145, p = 0.002) and a significant interaction between task phase × group (F(3,34) = 2.470, p = 0.014) were found. A significant effect of group was found specifically in RR learning (F(3,34) = 5.106, p = 0.005). ELS females (n = 8) took significantly more trials to reach criterion than ELS males and control females (n = 10) (Bonferroni multiple comparisons post hoc test; p = 0.029 and p = 0.004, respectively).
(D) There was also a significant difference in the number of errors committed between task phases (RM ANOVA; F(3,34) = 6.635, p < 0.001) and an interaction between group and task phase (F(3,34) = 2.675, p = 0.008). A significant difference between groups was again only observed in RR learning (F(3,34) = 8.413, p < 0.001), with ELS females committing significantly more errors than any other group (Bonferroni multiple comparisons post hoc test; ELS female [F] versus unhandled control (UHC) male [M], p = 0.038; ELS M, p = 0.001; and UHC F, p = 0.001).
(E) No significant differences in latency were observed among groups in any task phase. For all plots, data show means ± SEM. Significance is denoted as follows: # for main effects or interaction effects, and * for significant post hoc comparisons; *p < 0.05, **p < 0.005. In the case of a significant one-way ANOVA, F statistics are reported, but only the significant post hoc Bonferroni comparisons are shown.

