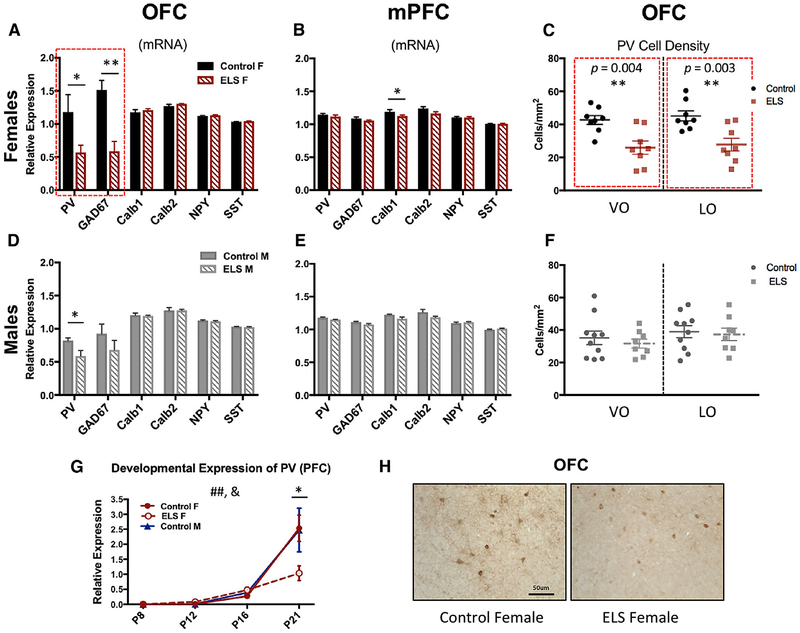
Figure 2. ELS Females Showed Significant Reductions in PV and GAD67 mRNA Expression and PV Cell Density in the OFC.
Quantitative real-time PCR analysis of relative mRNA expression of several interneuron markers—parvalbumin (PV), calbindin (Calb1), calretinin (Calb2), and somatostatin (SST), as well as neuropeptide Y (NPY) and GABA-synthesizing enzyme, and glutamic acid decarboxylase-67 kDa (GAD67)—was performed relative to control gene β-actin in the orbitofrontal cortex (left panels) and medial prefrontal cortex (middle panels). Top panels show female data (A–C); bottom panels show male data (D–F).
(A) In the OFC, female ELS-exposed mice had a significant and selective reduction of PV (t(1,11) = 2.282, p = 0.043) and GAD67 (t(1,11) = 2.429, p = 0.003) in comparison with control females. No other interneurons were affected by stress.
(B) In the mPFC of female animals, no effects of ELS were observed on PV, GAD67, NPY, or any other interneuron except a slight reduction in calbindin expression in ELS females (t(1,9) = 2.302, p = 0.047).
(C) Cell counts in the OFC show ELS females had a significant decrease in PV+ density in both the ventral orbitofrontal (VO) cortex (t(1,14) = 3.480, p = 0.004) and lateral orbitofrontal (LO) cortex (t(1,14) = 3.533, p = 0.003) regions of the OFC in comparison with control females.
(D–F) In males, we observe(D) a significant reduction in PV mRNA gene expression in the OFC (t(1,8) = 2.451, p = 0.040) of ELS mice, (E) no change in gene expression in the mPFC, and (F) this effect was not associated with changes in PV cell density in this region. No other interneuron markers were affected, nor were any changes detected in the mPFC.
(G) PV expression in the prefrontal cortex (PFC) increases across development in all groups (F(3,53) = 36.404, p < 0.000) but is significantly affected by ELS (treatment × day interaction; F(6,50) = 2.725, p = 0.024). Specifically, by P21, ELS females showed a significant reduction in PV expression in comparison with control animals (F(1,13) = 6.020, p = 0.029).
(H) Images from the OFC of adult control and ELS females show PV+ immunohistochemical labeling (images at 203 magnification; scale bar, 50 ~M ). For all plots, data show means ± SEM and are analyzed using two-tailed Student’s t tests or ANOVA. Significance is denoted as follows: # for main effects or interaction effects, and * for post hoc or pairwise comparisons; *p < 0.05, **p < 0.005.

