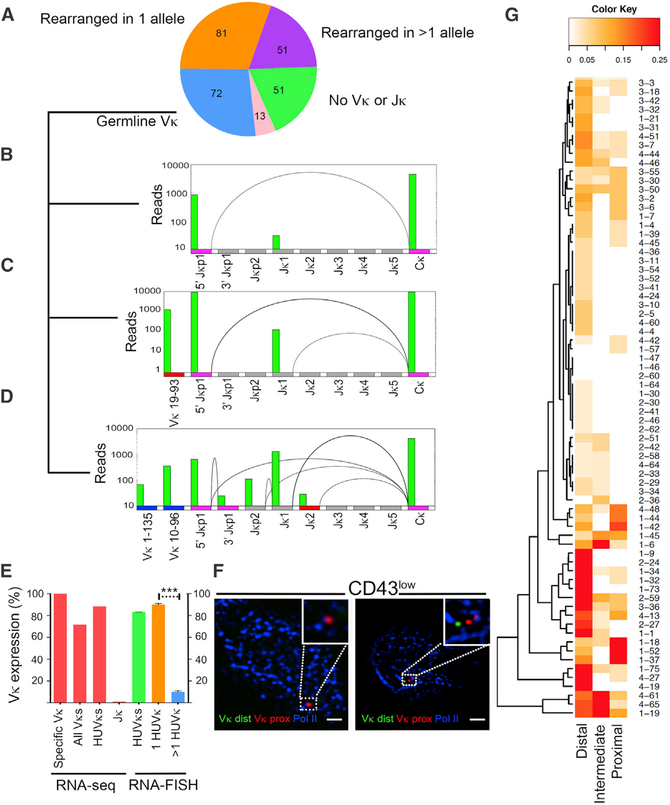
Figure 1. Monoallelic Activation of Vκ.
(A) Single-cell RNA-seq Igκ expression profile of CD19+B220+CD43loIgM- small pre-B cells. Of 268 cells captured, number of cells expressing germline VκJκ (blue), rearrangement in one Igκ allele (orange), rearrangement in more than one allele (purple), no Vκ or Jκ expression (green), or uncategorized (pink) are shown.
(B) Representative example of biallelic germline transcription of 5′Jκ1 promoter (magenta) without Vκ expression. mRNA splice products here and below are shown as arcs.
(C) Representative example of biallelic germline transcription of 5′Jκ1 promoter (magenta) with single Vκ expression from B6 allele (red).
(D) Representative example of biallelic germline transcription of 5′Jκ1 promoter (magenta) with multiple Vκ expression from CAST allele (blue).
(E) Percentage of cells with monoallelic expression as determined by either RNA-seq (left bars) or RNA-FISH (right bars). From left to right, percentages of cells expressing specific Vκ genes monoallelically (specific Vκ), cells expressing all Vκ genes from one allele (all Vκs), cells expressing highly used Vκs monoallelically (HUVκs), and monoallelic Jκ expression (Jκ) are shown. Based on RNA-FISH, percentage of cells monoallelically expressing one or more assayed HUVκs (green bar) is shown. Percentage of cells monoallelically expressing only one (1 HUVκ, orange) or >1 HUVκ (blue) is shown. Statistical significance was calculated on 100 cells per condition combined from two independent experiments by unpaired Student’s t test (***p < 0.001).
(F) Representative images of RNA-FISH for nascent transcripts from all nine highly used Vκ genes combined with staining for e-Pol II (blue). Distal Vκs are in green and proximal in red. The scale bars represent 1 μm.
(G) Heatmap of Vκs expressed from distal (Vκ 2–137 to 13–84), intermediate (Vκ 4–81 to 6–32), and proximal (Vκ 8–30 to 3–1) loops in each single cell (cell number given on right). Color reflects fraction of Vκ genes in indicated domains expressed in individual cells (scale 0%–25%).

