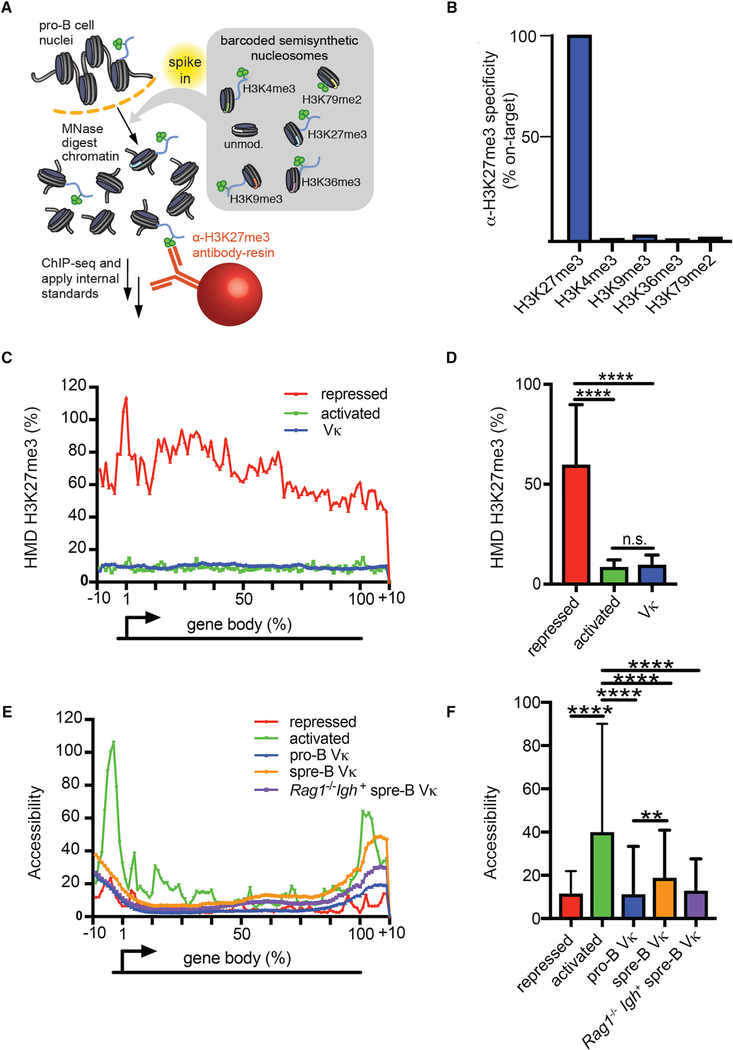
Figure 3. In Pro-B Cells, the Vκ Genes Lack Appreciable H3K27me3.
(A) Schematic representation of ICeChIP-seq.
(B) ICeChIP-seq-based specificity measurement of αH3K27me3 (CST C36B11) antibody. Specificity is expressed as a fraction of normalized H3K27me3 nucleosome capture.
(C) Meta-analysis of H3K27me3 ICeChIP displaying the average HMD over the length of each gene body for the following gene sets: Vκ regions; activated genes; and repressed genes in pro-B cells (Table S2).
(D) H3K27me3 HMD in pro-B cells comparing Vκ gene segments to activated genes and repressed genes as in (C).
(E) Meta-analysis of accessibility (ATAC-seq) displaying the average HMD over the length of each gene body for the following gene sets: Vκ regions in pro-B cells (pro-B); Vκ regions in small pre-B cells (spre-B); Vκ regions in Rag1−/−Igh+ small pre-B cells; activated genes in pro-B cells; and repressed genes in pro-B cells.
(F) Accessibility calculated from – 10% to +10% relative to the transcription start site (TSS) for each gene set displayed.
(D–F) Statistical significance was determined by ANOVA (p < 0.0001 and p < 0.0001, respectively) in combination with Tukey’s multiple comparison test. Error bars represent the average ± SD. **p ≤ 0.01; ****p ≤ 0.0001.

