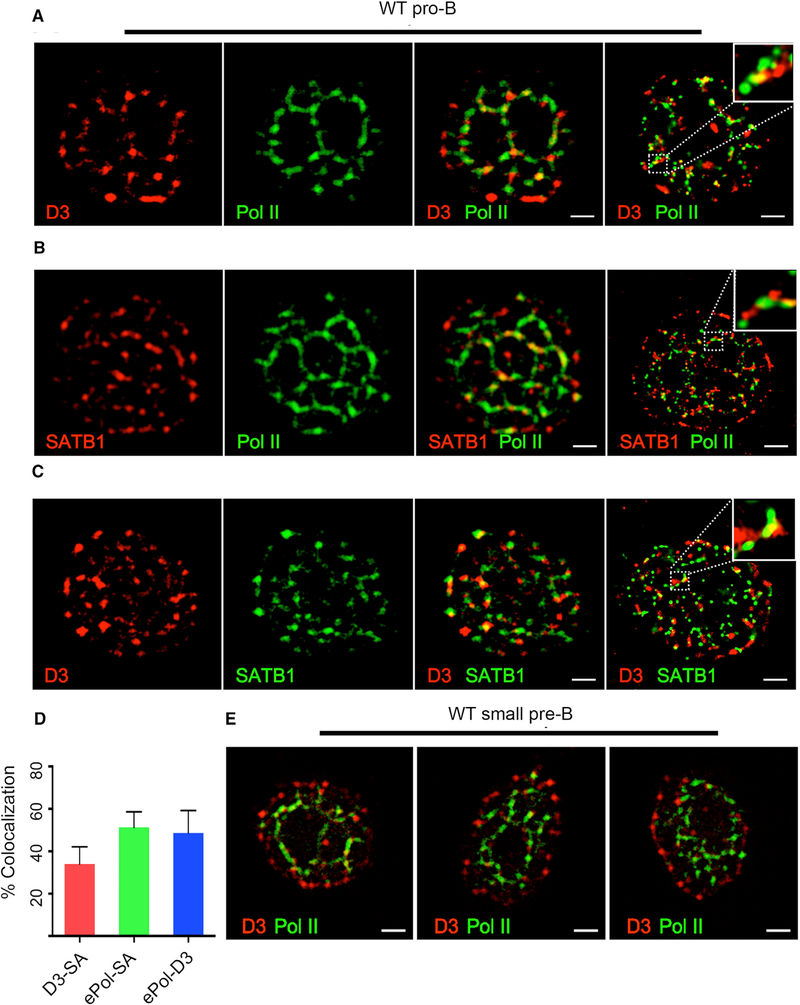
Figure 4. Cyclin D3 Is Assembled with RNAP on the Nuclear Matrix.
(A) Representative confocal images (from 40 cells; n = 2 experiments) of WT pro-B cells washed 10× (CSK+0.5%Triton) to remove soluble nuclear proteins and then fixed and stained with antibodies specific for cyclin D3 and e-Pol II (RNAP). Super-resolution image of similarly stained WT pro-B cells (right panel) is shown. The scale bars represent 1 μm.
(B) Representative confocal images (40 cells; n = 2 experiments) of WT pro-B cells washed and fixed as above and then stained with antibodies specific for SATB1 and e-Pol II. Super-resolution image of similarly stained WT pro-B cells (right panel) is shown. The scale bars represent 1 μm.
(C) Representative confocal images (40 cells; n = 2 experiments) of WT pro-B cells washed and fixed as above and then stained with antibodies specific for SATB1 and cyclin D3. Super-resolution image of similarly stained WT pro-B cells (right panel) is shown. The scale bars represent 1 μm.
(D) Percent co-localization of elongating RNAP-D3 (ePol-D3), D3-SATB1 (D3-SA), and RNAP-SATB1 (ePol-SA) stains calculated by using Manders on 30 2Dconfocal images per samples (n = 2 experiments).
(E) Representative confocal images (40 cells; n = 2 experiments) of WT small pre-B cells washed as above and stained with antibodies specific for cyclin D3 and RNAP. The scale bars represent 1 μm.

