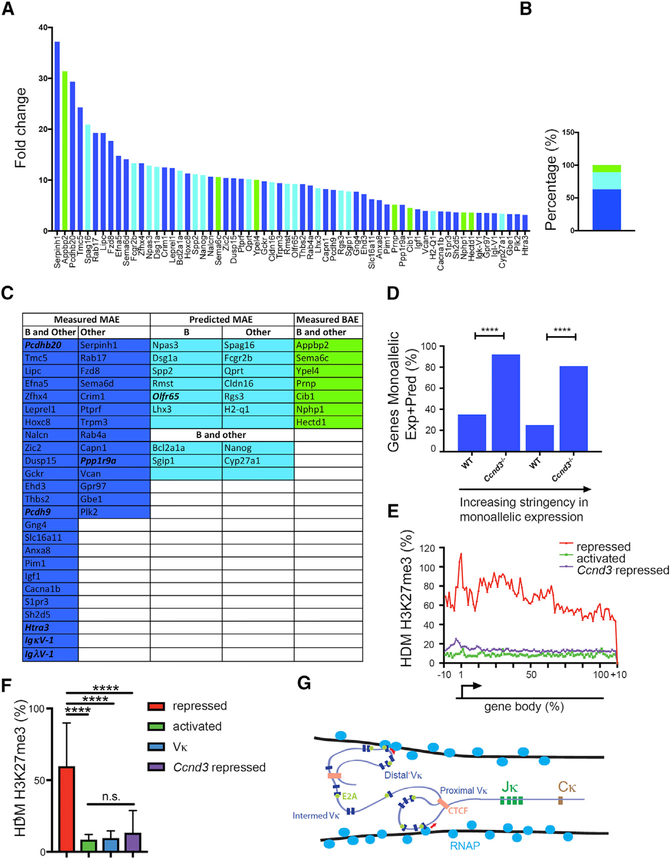
Figure 7. Cyclin D3 Represses Other Mono-allelically Expressed Genes.
(A) Upregulated genes in Ccnd3−/− pro-B cells on microarray hierarchically ranked by fold increase over WT pro-B cells ( = >3-fold) plotted. Genes experimentally measured as monoallelic in B and other tissues are shown in blue, those predicted monoallelic in B cells and other tissues are shown in light blue, and those that are measured biallelic in B cells and other tissues are shown in green.
(B) Percentage of genes measured as in (A). Monoallelic (MAE) in B cells and other tissues (blue), predicted monoallelic (light blue), and biallelic (BAE) in B cells and other tissues (green) are shown.
(C) List of monoallelic and biallelic genes in Ccnd3−/− pro-B cells, where genes are color coded as in (A) and (B). Imprinted genes (Ppp1r9a and Htra3), olfactory receptor genes (Olfr65), Igκ variable (IgκV-1), Igλ (IgλV-1) variable, and protocadherin genes (Pcdhb20 and Pcdh9) are bold and italicized.
(D) Percentage of randomly monoallelic genes expressed in WT and Ccnd3−/− pro-B cells. Two criteria are used. Bars on left show fraction of expressed genes known to be monoallelically expressed in at least three of five B cell lines and in at least five other tissues. Bars on right show fraction of expressed genes known to be monoallelically expressed in at least ten other tissues. Statistical significance was measured by Fisher’s exact t test (left, ****p = 1.3 × 10–07; right, ****p = 2.4 × 10–09).
(E and F) Metagene analysis of H3K27me3 ICeChIP displaying the average HMD over the length of each gene body for the following gene sets: Ccnd3 repressed genes; activated genes; and repressed genes in pro-B cells (E). H3K27me3 HMD in pro-B cells comparing Ccnd3 repressed genes to Vκ gene-segments, activated genes, and repressed genes (F) is shown. Statistical significance was determined by ANOVA p < 0.0001 in combination with Tukey’s multiple comparison test. Error bars represent the average ± SD. ****p ≤ 0.0001.
(G) Model of Vκ repertoire diversity. Our data indicate that Vκ genes are surrounded by transcription factories (NM-bound RNAP; cross-section shown). With loss of cyclin D3, Vκ-gene-containing TADs can stochastically engage one or more transcription factories with transcription either being initiated at E2A-bound promoters (red arrows) or CTCF sites.

