Abstract
Background:
Contrast-enhanced ultrasound (CEUS) is a non-invasive method that has been used in the diagnosis of several diseases. Recently, CEUS has been used in the differentiation of benign and malignant thyroid nodules. However, the performance of CEUS in thyroid nodules has not been studied clearly.
Methods:
The databases of Pubmed, Embase, Cochrane library and the unpublished studies were systematically searched for candidate inclusions, with the use of CEUS in differentiating the benign and malignant thyroid nodules. The quality of included studies was assessed using Quality Assessment of Diagnostic Accuracy Studies (QUADAS) questionnaire. The pooled estimates of sensitivity, specificity, diagnostic odds ratio (DOR), positive and negative likelihood ratio (NLR) were calculated using STATA software version 14.0.
Results:
Totally 33 diagnostic studies were included for further analysis. The quality of included studies was relatively high using QUADAS method. The pooled estimates of sensitivity and specificity were 0.88 (95% CI 0.85, 0.91) and 0.88 (95% CI 0.83, 0.91), respectively. In addition, the DOR, the positive and NLRs were pooled positive LR and the negative LR were 54 (95% CI 33, 89), 7.1% (5.2%, 9.8%), and 0.13% (0.10%, 0.18%). No significant publication bias was observed.
Conclusions:
Our meta-analysis further indicated that CEUS is a useful tool in differentiating benign and malignant thyroid nodules, with high sensitivity and specificity.
Keywords: contrast-enhanced ultrasound, diagnostic accuracy, meta-analysis, thyroid nodules
1. Introduction
Thyroid nodules have a high prevalence of 19% to 67% among different populations, of which the malignant nodules account for almost 5% to 10% according to previous reports.[1,2] Since the early trend of lymphatic metastasis, the diagnosis and distinguish between the benign and malignant thyroid nodules become important for doctors.[3] Currently, the most commonly used diagnostic tools for thyroid nodules were the ultrasound (US) and the fine-needle aspiration (FNA). Conventional sonographic technique has been used to distinguish between benign and malignant thyroid nodules by exhibiting the echogenicity, margins, presence of microcalcifications, and vascular flow, which is the choice of first-screen by doctors. Although widely used due to the features of non-invasiveness and inexpensiveness, the diagnostic sensitivity and specificity are not satisfactory, since the sonograms of some lesions were overlapped between the benign and the malignant nodules.[4–6] On the other hand, FNA is widely adopted by clinicians as a simple, minimally invasive way of diagnosing thyroid nodules with sensitivity and specificity ranged from 65% to 98% and 72% to 100%, respectively. However, this technique is invasive and still have false positive or negative outcomes, with relatively poor sensitivity.[7–9] It is reported approximately 10% to 20% of thyroid nodules could not be diagnosed and some patients refuse to undergo FNA biopsy. Therefore, finding a way to increase the diagnostic accuracy would spare a large number of patients an unnecessary invasive procedure and other effective US examinations are needed for the diagnosis of benign and malignant thyroid nodules.
Recent advances in technology increase the accuracy of US in the diagnosis of thyroid nodules. Especially the contrast-enhanced ultrasound (CEUS) could exhibit both of the micro-and macro-vascularization and the perfusion assessment overtime, with the help of microbubble contrast material to investigate the dynamic enhancing pattern.[10,11] CEUS allows studying dynamic enhancement patterns of focal thyroid nodules in real time and thus provides much better characterization of focal thyroid nodules than conventional US. The technique of CEUS has been shown to play important roles in different fields, especially in liver lesions.[12,13] However, the diagnostic value of CEUS on the characterization of thyroid nodules have not been reported very much and not been incorporated to the published guidelines on non-liver application.[14] The 2013 NCCN guidelines did not discuss the role of CEUS on the diagnosis of the thyroid lesions while the Chinese thyroid cancer diagnosis and therapy guidelines in 2012 stated that CEUS on thyroid nodules need further investigation.[15] Previous meta-analyses showed that CEUS might improve the diagnostic accuracy of thyroid nodules, but these studies are not up-to-date and the number of these studies is quite few.[16,17] In this meta-analysis, we searched the diagnostic studies of CEUS on the distinction of benign and malignant nodules and summarized the pooled estimates of different parameters, including the sensitivity, specificity, the diagnostic odds ratio (DOR) and the posttest probabilities, while drawing the summary receiver operating characteristic (SROC) and hierarchical summary receiver operating characteristic (HSROC) curves. This meta-analysis may help further investigating the diagnostic roles of CEUS on the thyroid nodules and provide some insights into the differentiation of thyroid nodules.
2. Materials and methods
2.1. Literature search
In this meta-analysis, major databases (Pubmed, Embase and the Cochrane library) and unpublished data (www.clinicaltrials.gov) were searched for possible candidate articles published until May, 2018. MESH terms and other terms were both used for literature searching using different combinations. The terms used included “thyroid nodules”, “thyroid neoplasm”, “thyroid”, “diagnosis”, “diagnostic”, “contrast-enhanced ultrasound”, and “CEUS”. The searches were limited to identify the diagnostic studies without language restrictions. Two authors (Q Liu and J Cheng) conducted the literature searching independently with a third investigator (J Li) solved any discrepancy. The study was approved by the Ethics Committee of the People's Hospital of Rizhao.
2.2. Study selection
After searching the candidate studies for inclusion, we set the inclusion and exclusion criteria for further identification. Publications were selected if they met the following criteria:
-
1.
The studies that assessed the diagnostic accuracy of CEUS for the distinction between benign and malignant thyroid nodules, that is, the studies using CEUS to evaluate the nature of thyroid nodules to be benign or malignant, elucidating the diagnostic accuracy of CEUS with reference methods such as FNA or pathological results;
-
2.
The studies that adopted the appropriate reference diagnostic standard, the pathology diagnosis, defined as the histology and cytology of biopsy specimens or histology of the surgical specimens;
-
3.
The studies that provided the diagnostic data that were sufficient for us to calculate the values of true-positive (TP), false-positive (FP), true-negative (TN) and false-negative (FN) results for the 2 × 2 contingency table.
The publications were excluded if:
-
1.
they did not provide sufficient data for calculating the TP, FP, TN, and FN parameters;
-
2.
the thyroid lesions were not measured;
-
3.
repeated or updated reports of studies with same group of participants;
-
4.
the articles were case reports, reviews, editorials, or meta-analysis that did not meet the inclusion criteria.
2.3. Data extraction and quality assessment
Two investigators (Q Liu and J Cheng) extracted the data from the included studies with a third investigator (J Li) solved any discrepancy by consensus. The data extracted were as follows: journals, authors, year of publication, country, participant characteristics (number of patients, age, and sex), number of thyroid nodules, reference methods adopted, the concrete data of TP, FP, TN, and FN. In the data extraction process, the values of these parameters could by extracted directly or indirectly through the studies included. If no direct data of TP, FP, TN, and FN, these values could be calculated backward through the sensitivity and specificity rates, the positive predictive value (PPV), and the negative predictive value (NPV). The quality of included studies was assessed using the Quality Assessment of Diagnostic Accuracy Studies (QUADS) questionnaire according to previous study.[18]
2.4. Data synthesis and statistical analysis
After data extraction, the bivariate model and the HSROC model were used to estimate the pooled sensitivity, specificity, positive likelihood ratio (PLR) and the negative likelihood ratio (NLR). The post-test probabilities were calculated by the PLR and NLR and plotted on a Fagan nomogram. The HSRPC curve was also plotted to illustrate the relationship between sensitivity and specificity. In addition, the publication bias was assessed using the Deeks’ method.[19] All the data analysis and the graphs were made using the STATA version 14.0 software for Windows (StataCorp, College Station, TX) with the commands MIDAS and METANDI. P <.05 was regarded as statistically significant.
3. Results
3.1. Characteristics of included studies
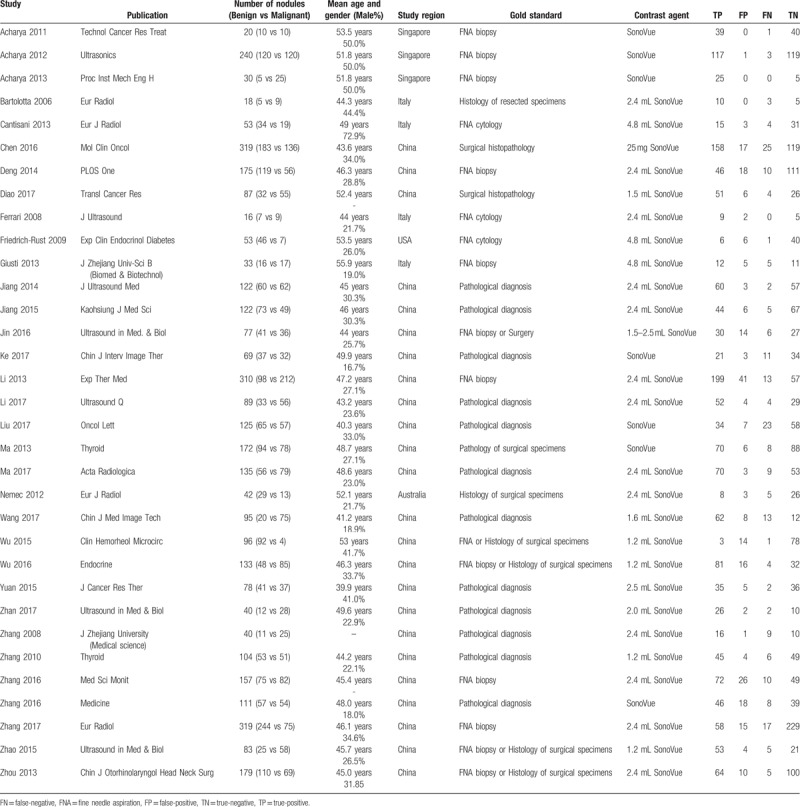
After searching the literature in the databases, totally 33 studies were included for further analysis[3,10,15,20–49] (Fig. 1). Table 1 showed the basic characteristics of included studies, including the number of patients and thyroid nodules, mean age and gender ratio, study region, gold standard, contrast agent and the 4 important parameters for further analysis (TP, FP, TN, and FN values). It showed that the mean age of patients included ranged from 39.9 to 55.9 years, with 3 studies conducted in Singapore, 4 studies in Italy, 1 in the USA, 1 in Australia and 24 studies performed in China. The contrast agent used of the included studies were all Sonovue, with different doses, ranging from 1.2 to 4.8 mL.
Figure 1.
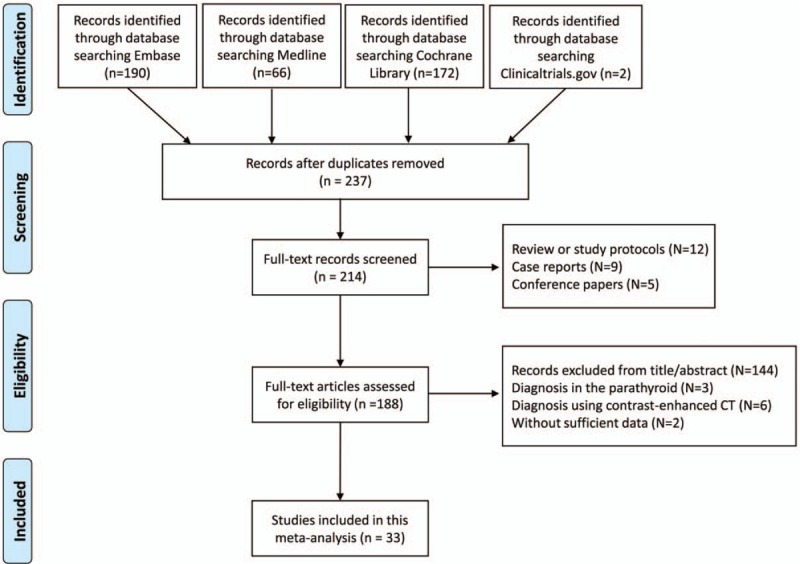
The flow diagram of literature searching and selection of studies according to the PRISMA criteria.
Table 1.
The baseline characteristics and the data extracted from the included studies.
3.2. Quality assessment
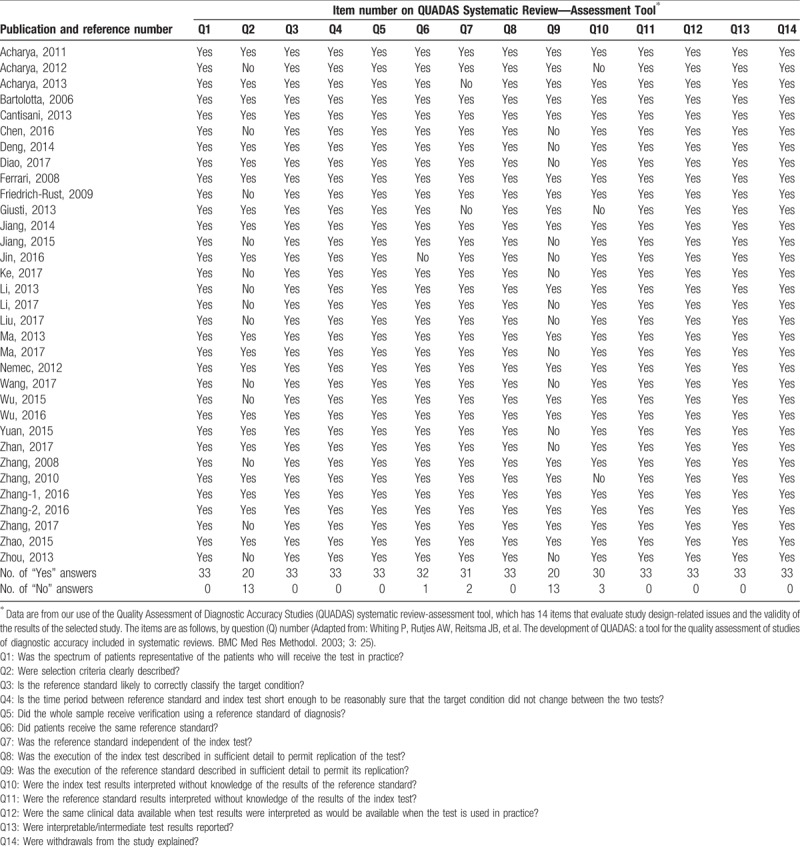
In this meta-analysis, the qualities of included studies were assessed using QUADS questionnaire, showed in Table 2. The study quality was defined as high when at least 9 of the total 14 items in the QUADAS checklist were considered “yes”. It showed that the overall quality of the included studies was high. For item 2, about whether the inclusion criteria were clearly described, 13 studies were answered with “No” while the other 20 studies were answered with “yes”. For item 6, 1 study was answered with “No” and the other studies were answered with “yes”. For item 7, concerning whether the reference standard was independent of the gold standard, was rated “no” for 2 studies, of which the gold standard consists of the reference standard. For item 9, about whether the details of the reference standard were clearly described, it showed that 13 studies were rated with answer “No”, without sufficient information of the reference standard. In addition, for item 10, concerning whether the index test results interpreted without knowledge of the results of the reference standard, 2 studies were answered with “No”. For the remaining items, all the studies included were answered with “yes”.
Table 2.
Quality assessment of the studies included in our meta-analysis.
3.3. Accuracy of CEUS in distinguish benign and malignant thyroid nodules
Using the bivariate model, it showed that the correlation coefficient was 0.18 with the ROC area 0.94 (95% CI 0.92–0.96), with relatively higher diagnostic values. The pooled sensitivity estimate was 0.88 with 95% confidence interval (CI) (0.85, 0.91) and the specificity estimate was 0.88 and 95% CI (0.83, 0.91). The pooled positive LR and the negative LR were 7.1% (5.2%, 9.8%) and 0.13% (0.10%, 0.18%), respectively. Furthermore, the DOR was 54 with the 95% CI (33, 89). Significant heterogeneity was found for sensitivity (I2 = 79.78%, Q = 158.23) and for specificity (I2 = 85.14%, Q = 215.41) (Fig. 2). The Fagan nomogram showed that the CEUS finding that was suspicious for malignant increased the pretest probability of cancer from 49% to 87%, whereas a normal CEUS finding decreased the pretest probability from 49% to 11% (Fig. 3). We did not observe significant publication bias using the Deek's funnel plot asymmetry test (Fig. 4).
Figure 2.
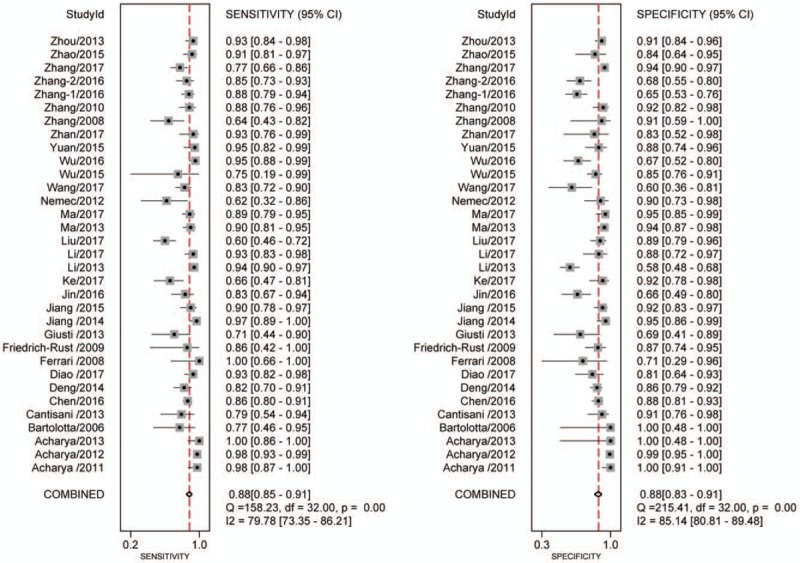
Forest plot for the pooled estimates of sensitivity and specificity of CEUS on the differentiation of thyroid nodules. CEUS = contrast-enhanced ultrasound.
Figure 3.
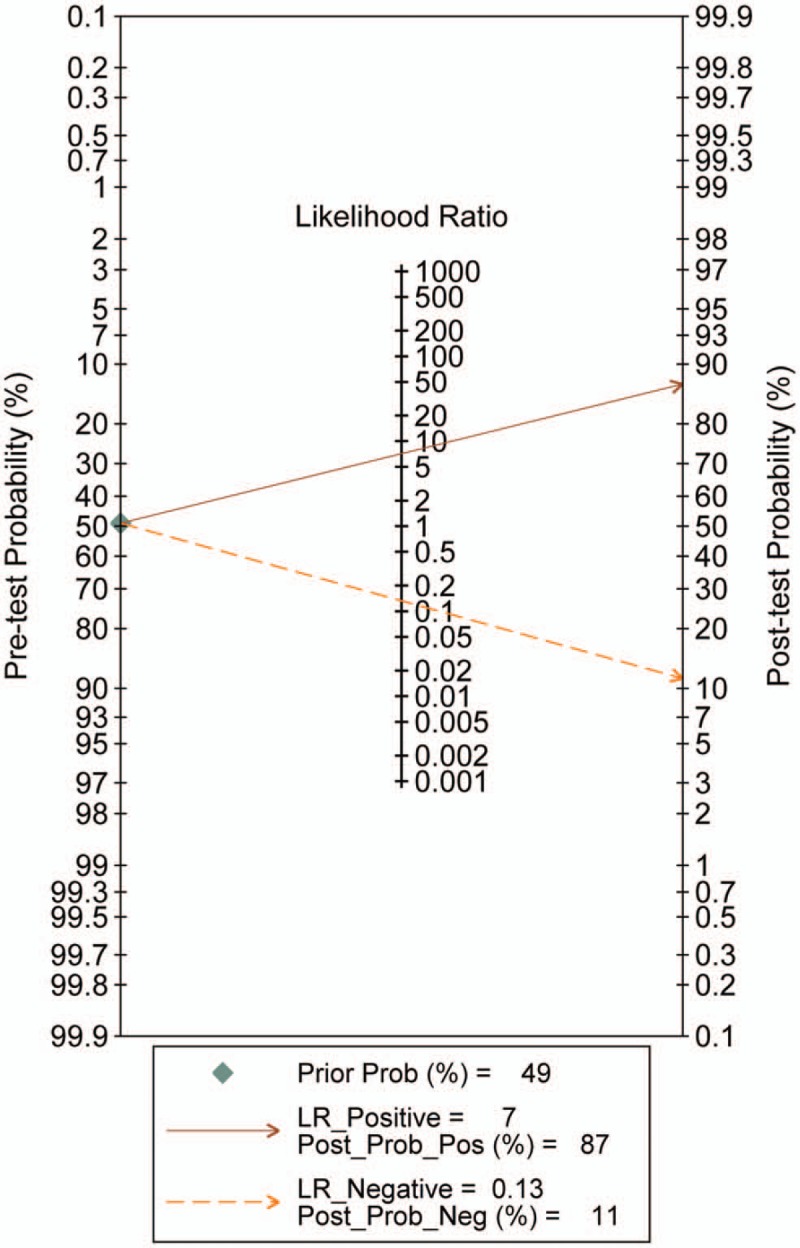
Fagan nomogram for the differentiation of thyroid nodules with CEUS. CEUS = contrast-enhanced ultrasound.
Figure 4.
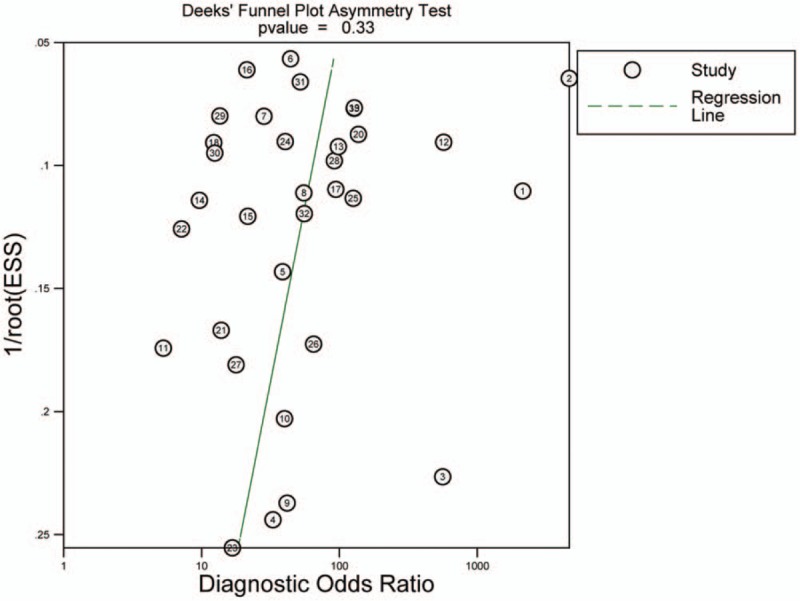
Deeks’ funnel plot for the assessment of publication bias.
For the HSROC model (Fig. 5), the pooled estimate and 95% CI of sensitivity, specificity, positive LR, negative LR, and the DOR were 0.88 (0.85, 0.91), 0.88 (0.83, 0.91), 7.13% (5.21%, 9.77%), 0.13% (0.10%, 0.18%), and 53.97 (32.63, 89.27), which were almost identical with the bivariate model.
Figure 5.
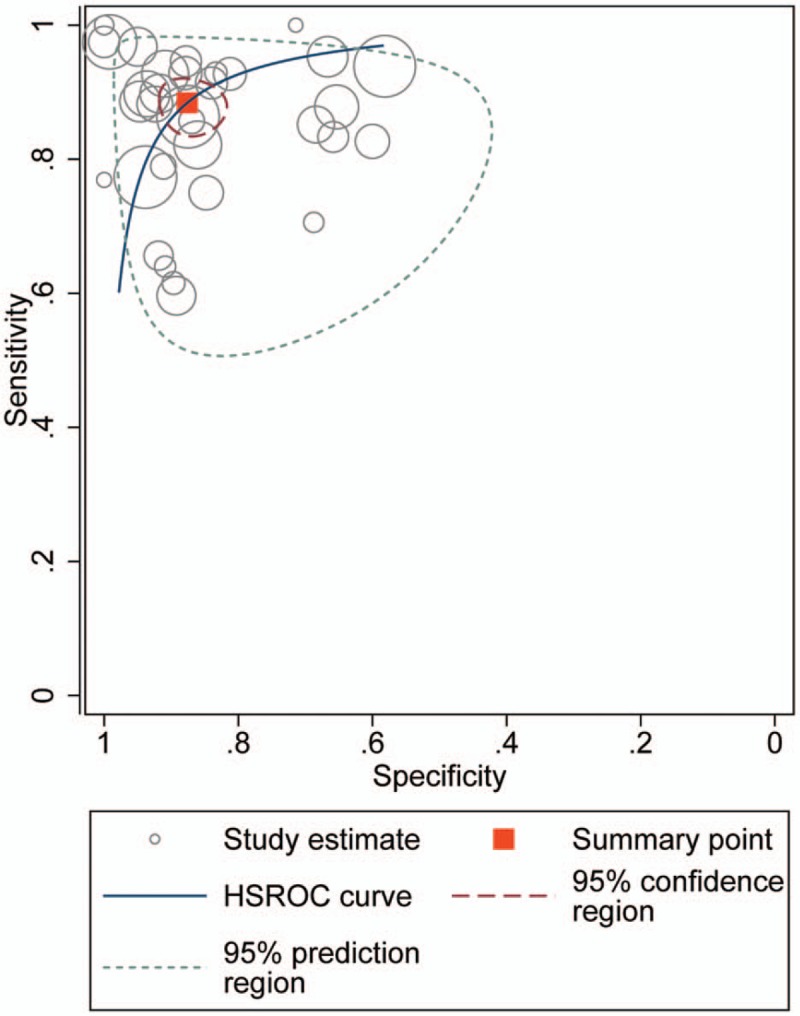
HSROC curve for CEUS on the diagnosis of thyroid nodules. CEUS = contrast-enhanced ultrasound, HSROC = hierarchical summary receiver operating characteristic.
4. Discussion
In this meta-analysis, we analyzed the diagnostic accuracy of CEUS on thyroid nodules by searching and including all the eligible diagnostic studies. We showed that sensitivity and specificity of CEUS on differentiation of thyroid nodules were 0.88 (0.85, 0.91) and 0.88 (0.83, 0.91), respectively. The DOR was 54 (33, 89), while the pooled positive LR and the negative LR were 7.1% (5.2%, 9.8%) and 0.13% (0.10%, 0.18%), respectively. Using SROC and HSROC model for further analysis, we got similar results and no significant publication bias using the Deek's funnel plot asymmetry test. Our study further improved the diagnostic values of CEUS on thyroid nodules, with previous reporting the sensitivity and specificity of 90% (95% CI, 88–93%) and 86% (95% CI, 83%, 89%) in the study of Ma et al[17], and the pooled sensitivity and specificity were 0.853 and 0.876 in the study of Yu et al.[16]
US is the most commonly used diagnostic tool in thyroid diseases. However, conventional US techniques could not differentiate the benign and malignant nodules accurately and efficiently.[23] Currently, several systems have been developed to help improve the diagnostic values of US in differentiation of the thyroid nodules, such as the Conventional color-Doppler ultrasound (CDUS), the quantitative-elastosonography, the acoustic radiation force impulse (ARFI)[25] and the thyroid image reporting and data system (TI-RADS). These diagnostic tools could be further divided into quantitative and qualitative methods and have both advantages and disadvantages. For example, the CDUS could not show the vessels clears in the thyroid nodules. The quantitative elastosonography has superior sensitivity compared with CEUS, which could provide additional information on the elastic properties of the tissue, but still, several variabilities existed in the diagnostic process.[4,23] Therefore, finding effective and special ways in the diagnosis of thyroid nodules is important.
CEUS has emerged as a useful tool in the field of medical US over the past decade. The diagnostic effects of CEUS have been studied for years in the examination of liver, uterus, prostate and other organs.[24] The advantage of CEUS is that it could exhibit the blood supply in the thyroid nodules, which is the character of malignant tumors. Meanwhile, CEUS could accurately evaluate the sequence and intensity of tumor perfusion and vascularity. In fact, CEUS is reported to provide both qualitative and quantitative evaluation of the contrast enhancement of thyroid nodules in previously published studies. Nevertheless, there are no unified standards for quantitative or qualitative studies, so no single feature of CEUS seems to be sensitive and specific enough for diagnosis of malignancy. Further studies are still needed to explore a reliable diagnostic standard for CEUS in differentiating thyroid nodules.[11] Furthermore, a recent meta-analysis of 7 eligible studies has found that the qualitative evaluation acquired better sensitivity and specificity for the differentiation of benign and malignant nodules, compared with the quantitative evaluation.[16] Even in our study, the studies included still have different methods in interpreting the results of CEUS, resulting in a relative high heterogeneity. Therefore, more advances and detailed methods needed to be further addressed in further studies.
This diagnostic meta-analysis has several limitations. First, a majority of studies were conducted in China, which might suitable for the patients in Chinese areas. Second, the procedures of performing CEUS in patients are complex and cost high in the examination. Third, the uniform standard of CEUS imaging is still not reached and more efforts need to be payed on the imaging of CEUS examination.
In conclusion, our meta-analysis is the one of the comprehensive and relatively new studies investigating the diagnostic accuracy of CEUS in differentiating of benign and malignant thyroid nodules. Our data showed that CEUS had good sensitivity and specificity and should be chosen with priority in thyroid diagnosis.
Author contributions
Conceptualization: Qinghua Liu, Hongbo Li, Jingjing Li.
Data curation: Qinghua Liu, Jian Cheng.
Formal analysis: Qinghua Liu, Jian Cheng, Hongbo Li.
Investigation: Qinghua Liu, Jian Cheng, Xiang Gao, Jingjing Li.
Methodology: Qinghua Liu, Jian Cheng, Xiang Gao.
Resources: Xiang Gao, Hongbo Li.
Software: Jian Cheng.
Supervision: Hongbo Li, Jingjing Li.
Validation: Jingjing Li, Hongbo Li.
Writing – original draft: Qinghua Liu.
Writing – review & editing: Jingjing Li.
Footnotes
Abbreviations: CEUS = contrast-enhanced ultrasound, DOR = diagnostic odds ratio, FN = false-negative, FNA = fine-needle aspiration, FP = false-positive, HSROC = hierarchical summary ROC model, NLR = negative likelihood ratio, PLR = positive likelihood ratio, QUADAS = Quality Assessment of Diagnostic Accuracy Studies, SROC = summary receiver operating characteristic, TN = true-negative, TP = true-positive.
The authors have no conflicts of interest to disclose.
References
- [1].Haugen BR. 2015 American thyroid association management guidelines for adult patients with thyroid nodules and differentiated thyroid cancer: what is new and what has changed. Cancer 2017;123:372–81. [DOI] [PubMed] [Google Scholar]
- [2].Pellegriti G, Frasca F, Regalbuto C, et al. Worldwide increasing incidence of thyroid cancer: update on epidemiology and risk factors. J Cancer Epidemiol 2013;2013:965212. [DOI] [PMC free article] [PubMed] [Google Scholar]
- [3].Ma JJ, Ding H, Xu BH, et al. Diagnostic performances of various gray-scale, color Doppler, and contrast-enhanced ultrasonography findings in predicting malignant thyroid nodules. Thyroid 2014;24:355–63. [DOI] [PubMed] [Google Scholar]
- [4].Papini E, Guglielmi R, Bianchini A, et al. Risk of malignancy in nonpalpable thyroid nodules: predictive value of ultrasound and color-Doppler features. J Clin Endocrinol Metab 2002;87:1941–6. [DOI] [PubMed] [Google Scholar]
- [5].Gul K, Ersoy R, Dirikoc A, et al. Ultrasonographic evaluation of thyroid nodules: comparison of ultrasonographic, cytological, and histopathological findings. Endocrine 2009;36:464–72. [DOI] [PubMed] [Google Scholar]
- [6].Moon WJ, Baek JH, Jung SL, et al. Ultrasonography and the ultrasound-based management of thyroid nodules: consensus statement and recommendations. Korean J Radiol 2011;12:1–4. [DOI] [PMC free article] [PubMed] [Google Scholar]
- [7].Al-azawi D, Mann GB, Judson RT, et al. Endocrine surgeon-performed US guided thyroid FNAC is accurate and efficient. World J Surg 2012;36:1947–52. [DOI] [PubMed] [Google Scholar]
- [8].Bohacek L, Milas M, Mitchell J, et al. Diagnostic accuracy of surgeon-performed ultrasound-guided fine-needle aspiration of thyroid nodules. Ann Surg Oncol 2012;19:45–51. [DOI] [PubMed] [Google Scholar]
- [9].Pinchot SN, Al-Wagih H, Schaefer S, et al. Accuracy of fine-needle aspiration biopsy for predicting neoplasm or carcinoma in thyroid nodules 4 cm or larger. Arch Surg 2009;144:649–55. [DOI] [PMC free article] [PubMed] [Google Scholar]
- [10].Bartolotta TV, Midiri M, Galia M, et al. Qualitative and quantitative evaluation of solitary thyroid nodules with contrast-enhanced ultrasound: initial results. Eur Radiol 2006;16:2234–41. [DOI] [PubMed] [Google Scholar]
- [11].Cantisani V, Bertolotto M, Weskott HP, et al. Growing indications for CEUS: the kidney, testis, lymph nodes, thyroid, prostate, and small bowel. Eur J Radiol 2015;84:1675–84. [DOI] [PubMed] [Google Scholar]
- [12].Greenbaum LD. Foreword to guidelines and good clinical practice recommendations for contrast enhanced ultrasound (CEUS) in the liver--update 2012. Ultraschall Med 2013;34:7. [DOI] [PubMed] [Google Scholar]
- [13].Dietrich CF. Comments and illustrations regarding the guidelines and good clinical practice recommendations for contrast-enhanced ultrasound (CEUS)–update 2008. Ultraschall Med 2008;29suppl 4:S188–202. [DOI] [PubMed] [Google Scholar]
- [14].Sidhu PS, Cantisani V, Dietrich CF, et al. The EFSUMB guidelines and recommendations for the clinical practice of contrast-enhanced ultrasound (CEUS) in non-hepatic applications: update 2017 (short version). Ultraschall Med 2018;39:154–80. [DOI] [PubMed] [Google Scholar]
- [15].Zhang Y, Luo YK, Zhang MB, et al. Diagnostic accuracy of contrast-enhanced ultrasound enhancement patterns for thyroid nodules. Med Sci Monit 2016;22:4755–64. [DOI] [PMC free article] [PubMed] [Google Scholar]
- [16].Yu D, Han Y, Chen T. Contrast-enhanced ultrasound for differentiation of benign and malignant thyroid lesions: meta-analysis. Otolaryngol Head Neck Surg 2014;151:909–15. [DOI] [PubMed] [Google Scholar]
- [17].Ma X, Zhang B, Ling W, et al. Contrast-enhanced sonography for the identification of benign and malignant thyroid nodules: Systematic review and meta-analysis. J Clin Ultrasound 2016;44:199–209. [DOI] [PubMed] [Google Scholar]
- [18].Whiting P, Rutjes AW, Reitsma JB, et al. The development of QUADAS: a tool for the quality assessment of studies of diagnostic accuracy included in systematic reviews. BMC Med Res Methodol 2003;3:25. [DOI] [PMC free article] [PubMed] [Google Scholar]
- [19].Deeks JJ, Macaskill P, Irwig L. The performance of tests of publication bias and other sample size effects in systematic reviews of diagnostic test accuracy was assessed. J Clin Epidemiol 2005;58:882–93. [DOI] [PubMed] [Google Scholar]
- [20].Acharya UR, Faust O, Sree SV, et al. Cost-effective and non-invasive automated benign and malignant thyroid lesion classification in 3D contrast-enhanced ultrasound using combination of wavelets and textures: a class of ThyroScan algorithms. Technol Cancer Res Treat 2011;10:371–80. [DOI] [PubMed] [Google Scholar]
- [21].Acharya UR, Vinitha Sree S, Krishnan MM, et al. Non-invasive automated 3D thyroid lesion classification in ultrasound: a class of ThyroScan systems. Ultrasonics 2012;52:508–20. [DOI] [PubMed] [Google Scholar]
- [22].Acharya UR, Sree SV, Swapna G, et al. Effect of complex wavelet transform filter on thyroid tumor classification in three-dimensional ultrasound. Proc Inst Mech Eng H 2013;227:284–92. [DOI] [PubMed] [Google Scholar]
- [23].Cantisani V, Consorti F, Guerrisi A, et al. Prospective comparative evaluation of quantitative-elastosonography (Q-elastography) and contrast-enhanced ultrasound for the evaluation of thyroid nodules: preliminary experience. Eur J Radiol 2013;82:1892–8. [DOI] [PubMed] [Google Scholar]
- [24].Chen M, Zhang KQ, Xu YF, et al. Shear wave elastography and contrast-enhanced ultrasonography in the diagnosis of thyroid malignant nodules. Mol Clin Oncol 2016;5:724–30. [DOI] [PMC free article] [PubMed] [Google Scholar]
- [25].Deng J, Zhou P, Tian SM, et al. Comparison of diagnostic efficacy of contrast-enhanced ultrasound, acoustic radiation force impulse imaging, and their combined use in differentiating focal solid thyroid nodules. PLoS One 2014;9:e90674. [DOI] [PMC free article] [PubMed] [Google Scholar]
- [26].Diao X, Zhan J, Chen L, et al. Quantification of solid hypo-echoic thyroid nodule enhancement with contrast-enhanced ultrasound. Transl Cancer Res 2017;6:1078–87. [Google Scholar]
- [27].Ferrari FS, Megliola A, Scorzelli A, et al. Ultrasound examination using contrast agent and elastosonography in the evaluation of single thyroid nodules: preliminary results. J Ultrasound 2008;11:47–54. [DOI] [PMC free article] [PubMed] [Google Scholar]
- [28].Friedrich-Rust M, Sperber A, Holzer K, et al. Real-time elastography and contrast-enhanced ultrasound for the assessment of thyroid nodules. Exp Clin Endocrinol Diabetes 2010;118:602–9. [DOI] [PubMed] [Google Scholar]
- [29].Giusti M, Orlandi D, Melle G, et al. Is there a real diagnostic impact of elastosonography and contrast-enhanced ultrasonography in the management of thyroid nodules. J Zhejiang Univ Sci B 2013;14:195–206. [DOI] [PMC free article] [PubMed] [Google Scholar]
- [30].Jiang J, Shang X, Zhang H, et al. Correlation between maximum intensity and microvessel density for differentiation of malignant from benign thyroid nodules on contrast-enhanced sonography. J Ultrasound Med 2014;33:1257–63. [DOI] [PubMed] [Google Scholar]
- [31].Jiang J, Shang X, Wang H, et al. Diagnostic value of contrast-enhanced ultrasound in thyroid nodules with calcification. Kaohsiung J Med Sci 2015;31:138–44. [DOI] [PubMed] [Google Scholar]
- [32].Jin L, Xu C, Xie X, et al. An algorithm of image heterogeneity with contrast-enhanced ultrasound in differential diagnosis of solid thyroid nodules. Ultrasound Med Biol 2017;43:104–10. [DOI] [PubMed] [Google Scholar]
- [33].Ke K, Zhang Q, Wang Z. Thyroid imaging reporting and data system virtual tough tissues quantification technique and CEUS in differential diagnosis of benign and malignant thyroid nodules. Chin J Interv Imaging Ther 2017;14:287–91. [Google Scholar]
- [34].Li F, Luo H. Comparative study of thyroid puncture biopsy guided by contrast-enhanced ultrasonography and conventional ultrasound. Exp Ther Med 2013;5:1381–4. [DOI] [PMC free article] [PubMed] [Google Scholar]
- [35].Li F, Wang Y, Bai B, et al. Advantages of routine ultrasound combined with contrast-enhanced ultrasound in diagnosing papillary thyroid carcinoma. Ultrasound Q 2017;33:213–8. [DOI] [PubMed] [Google Scholar]
- [36].Liu MJ, Men YM, Zhang YL, et al. Improvement of diagnostic efficiency in distinguishing the benign and malignant thyroid nodules via conventional ultrasound combined with ultrasound contrast and elastography. Oncol Lett 2017;14:867–71. [DOI] [PMC free article] [PubMed] [Google Scholar]
- [37].Ma HJ, Yang JC, Leng ZP, et al. Preoperative prediction of papillary thyroid microcarcinoma via multiparameter ultrasound. Acta Radiol 2017;58:1303–11. [DOI] [PubMed] [Google Scholar]
- [38].Nemec U, Nemec SF, Novotny C, et al. Quantitative evaluation of contrast-enhanced ultrasound after intravenous administration of a microbubble contrast agent for differentiation of benign and malignant thyroid nodules: assessment of diagnostic accuracy. Eur Radiol 2012;22:1357–65. [DOI] [PubMed] [Google Scholar]
- [39].Wang Y, Nie F, Geng X, et al. CEUS in diagnosis of TI-RADS 3,4 thyroid nodules. Chin J Med Imaging Technol 2017;33:386–9. [Google Scholar]
- [40].Wu Q, Li Y, Wang Y. Diagnostic value of “absent” pattern in contrast-enhanced ultrasound for the differentiation of thyroid nodules. Clin Hemorheol Microcirc 2016;63:325–34. [DOI] [PubMed] [Google Scholar]
- [41].Wu Q, Wang Y, Li Y, et al. Diagnostic value of contrast-enhanced ultrasound in solid thyroid nodules with and without enhancement. Endocrine 2016;53:480–8. [DOI] [PubMed] [Google Scholar]
- [42].Yuan Z, Quan J, Yunxiao Z, et al. Contrast-enhanced ultrasound in the diagnosis of solitary thyroid nodules. J Cancer Res Ther 2015;11:41–5. [DOI] [PubMed] [Google Scholar]
- [43].Zhan J, Diao XH, Chen L, et al. Role of contrast-enhanced ultrasound in diagnosis of thyroid nodules in acoustic radiation force impulse “gray zone”. Ultrasound Med Biol 2017;43:1179–86. [DOI] [PubMed] [Google Scholar]
- [44].Zhang XF, Hong YR, Bao XF, et al. Qualitative evaluation of thyroid nodules with gray-scale contrast-enhanced ultrasound. Zhejiang Da Xue Xue Bao Yi Xue Ban 2008;37:515–8. [DOI] [PubMed] [Google Scholar]
- [45].Zhang B, Jiang YX, Liu JB, et al. Utility of contrast-enhanced ultrasound for evaluation of thyroid nodules. Thyroid 2010;20:51–7. [DOI] [PubMed] [Google Scholar]
- [46].Zhang YZ, Xu T, Gong HY, et al. Application of high-resolution ultrasound, real-time elastography, and contrast-enhanced ultrasound in differentiating solid thyroid nodules. Medicine (Baltimore) 2016;95:e5329. [DOI] [PMC free article] [PubMed] [Google Scholar]
- [47].Zhang Y, Zhou P, Tian SM, et al. Usefulness of combined use of contrast-enhanced ultrasound and TI-RADS classification for the differentiation of benign from malignant lesions of thyroid nodules. Eur Radiol 2017;27:1527–36. [DOI] [PMC free article] [PubMed] [Google Scholar]
- [48].Zhao RN, Zhang B, Yang X, et al. Logistic regression analysis of contrast-enhanced ultrasound and conventional ultrasound characteristics of sub-centimeter thyroid nodules. Ultrasound Med Biol 2015;41:3102–8. [DOI] [PubMed] [Google Scholar]
- [49].Zhou Q, Xu YB, Jiang J, et al. Differential diagnostic value of contrast-enhanced ultrasound in calcified thyroid nodules. Zhonghua Er Bi Yan Hou Tou Jing Wai Ke Za Zhi 2013;48:726–9. [PubMed] [Google Scholar]


