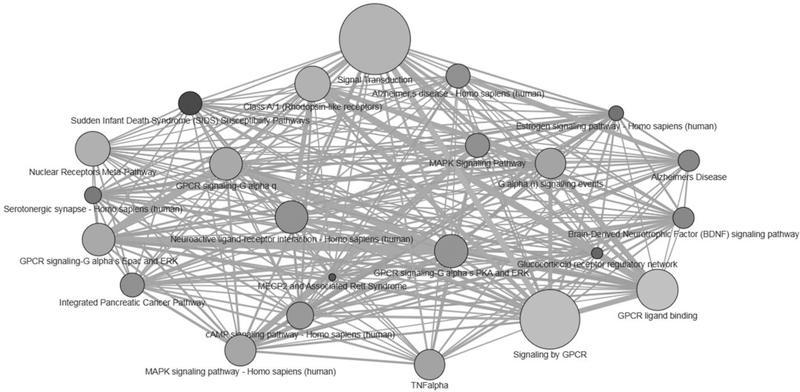
Figure 2.
Visualization of the inter-connectedness of pathways enriched for genes shared across the full cortisol-related and addiction gene sets.
Predefined gene sets compiled in Consensus Pathway DataBase and their pair-wise overlaps are shown. The size of each node (circle) reflects the size of the gene set. The darker the node, the more highly significantly enriched the pathway is for genes on the 28-gene overlap set (e.g., lower p-values from the over-representation analysis). Edges (lines) denote shared genes in each gene set; thicker edges denote more shared genes, whereas thinner edges denote fewer shared genes.

