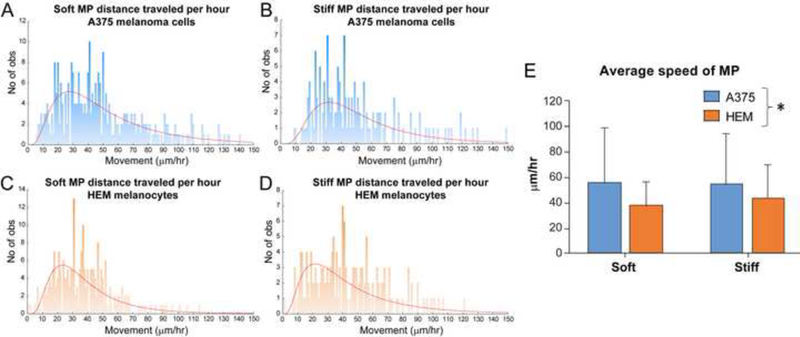
Figure 3.

Assessment of MP distance traveled per hour interval and average speed within HEM and A375 spheroids. (A-D) Histograms of the distribution of MP distance traveled per hour. Extreme outliers (>150 μm/hour) are not shown on graphs. (E) Calculations of average speed indicated that soft MPs moved more quickly in A375 spheroids than HEM spheroids. Data shown as mean ± S.D. (*p<0.05 for cell type as a factor). No of obs = Number of observations.
