
Figure 4. Effects of LCN2 on neuroinflammation.

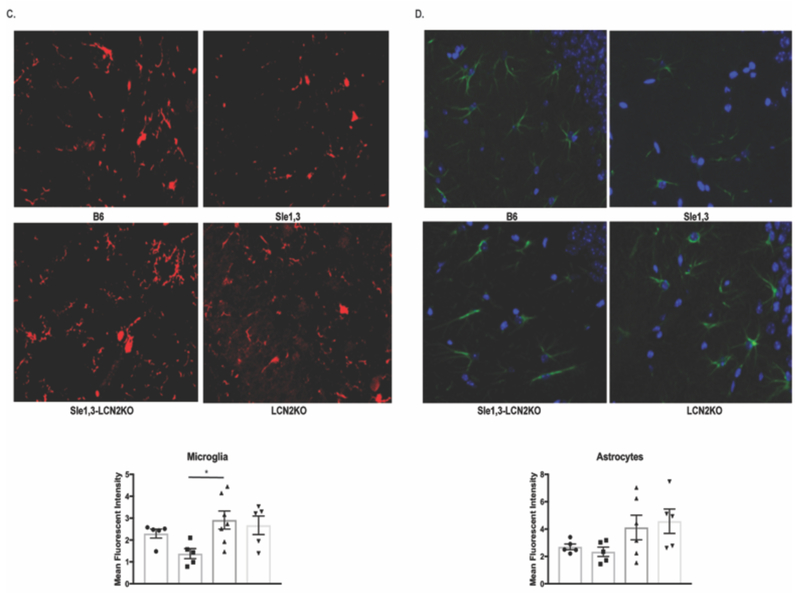
(A) Gene expression from cortical lysates were assessed by RT-PCR. LCN2: B6: n=3; Sle1,3: n=4; Sle1,3-LCN2KO: n=3; and LCN2KO: n=3; MMP9, CXCL10, and ICAM1: B6: n=3; Sle1,3: n=4; Sle1,3-LCN2KO: n=4; and LCN2KO: n=3. (B) Apoptosis was assessed in the dentate gyrus of the hippocampus by TUNEL at 20x magnification. The total number of TUNEL-positive cells and the number of apoptotic microglia and neurons were assessed. (C) Iba-1 and (D) GFAP staining was performed to assess (C) microglia and (D) astrocyte morphology and density. (B-C): B6: n=5; Sle1,3: n=5; Sle1,3-LCN2KO: n=7; and LCN2KO: n=5. (D): B6: n=5; Sle1,3: n=5; Sle1,3-LCN2KO: n=6; and LCN2KO: n=5. Representative images and mean fluorescent intensity are shown. Results are displayed as mean±SEM. *p<0.05, **p<0.01 and ***p<0.001 by ANOVA and post-hoc Dunnett’s multiple comparisons test (A: LCN2 and CXCL10; B: neuronal apoptosis; C-D) or by Kruskal-Wallis and post-hoc Dunn’s multiple comparisons test (A: MMP9 and ICAM-1; B: apoptosis and microglia apoptosis).