
Figure 6. Expression of several key genes is regulated by LCN2.
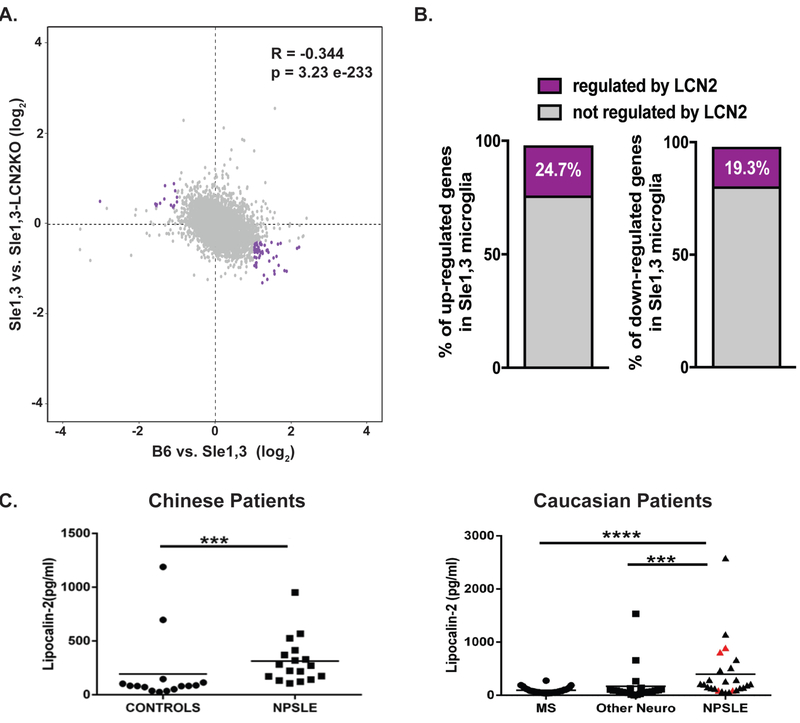
(A) Scatter plot of genes expressed by microglia (8435) displaying the log2 fold change in expression between B6 vs Sle1,3 (x axis) and Sle1,3 vs Sle1,3-LCN2KO microglia (y axis). Genes indicated in purple reflect those that are either increased or decreased in Sle1,3 microglia compared to B6 microglia by a fold change in expression >2 that are reversed by LCN2KO towards B6 levels by at least half the initial change in CPM values. (B) Percentage of genes either increased or decreased in expression in Sle1,3 microglia compared to B6 microglia with an adjusted p<0.1 (or a false discovery rate of 10%, as determined by DESeq2 Benjamin & Hochberg correction) and fold change in expression >2 that are reversed by LCN2KO towards B6 levels by at least half the initial change in CPM values (shown in purple). A complete list of differentially expressed genes is provided in Supplementary Table 4. (A-B) B6: n=4; Sle1,3: n=4; Sle1,3-LCN2KO: n=4; and LCN2KO: n=4. (C) LCN2 was quantified in the CSF of 2 cohorts of NPSLE patients and controls. Among the Caucasian patients, patients with neuropsychiatric symptoms attributable to SLE are represented by black triangles, while SLE patients with neuropsychiatric symptoms attributable to other primary causes are represented by red triangles. Dot plots were plotted using Prism 5 software. Mann Whitney U test was used to generate P values, comparing the protein level differences among the sample groups. * = p<0.05, ** = p < 0.01, *** = p < 0.001, **** = p < 0.0001.