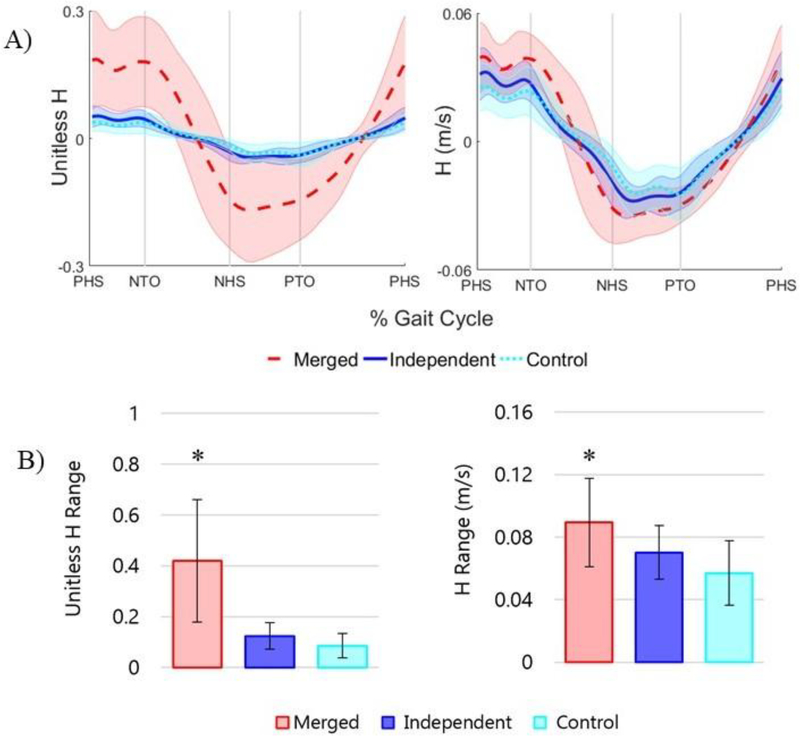
Fig. 2.
Group averaged frontal plane A) H and B) HR ± one standard deviation for the merged, independent and control groups. Results are shown for unitless H (normalized by body mass, leg length, and walking speed) and H not normalized by walking speed (units = m/s, normalized by body mass and leg length). Vertical lines show average paretic and nonparetic heel strikes (PHS, NHS) and toe-offs (PTO, NTO) as indicated on the horizontal axis. ‘*” indicates a significant difference between the HR of the merged group and the independent and control groups.

