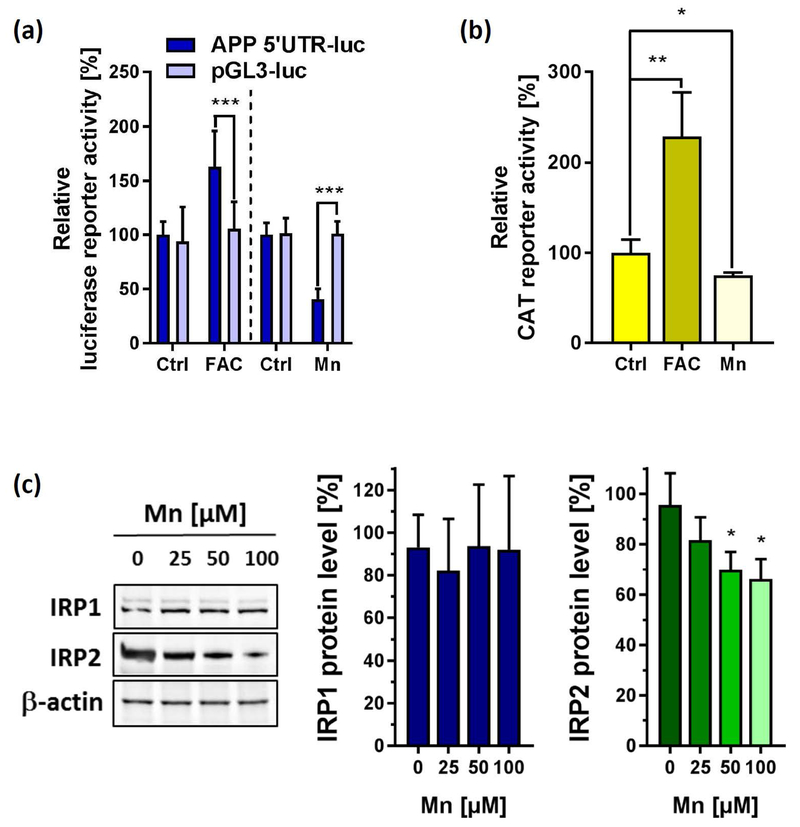
Figure 3: The effect of Mn and FAC on IRE/IRP-dependent expression of APP and H-Ferritin.
(a) SH-SY5Y cells transfected with the pGL3 construct expressing the 146-nucleotide APP 5’UTR sequence (APP 5’-UTR) or empty plasmid (pGL3) were left untreated (Ctrl) or exposed to either 50 µM Mn (n=7) or 50 µM FAC (n=4) for 24 h and analyzed for luciferase activity. Data are depicted as relative luciferase activity compared to untreated controls. (b) In a similar fashion, SH-SY5Y cells were transfected with the HIRE-CAT construct (H-Ferritin 5’-UTR) and treated with either 50 µM Mn or 50 µM FAC for 24 h or left untreated (Ctrl) and analyzed for CAT (chloramphenicol acetyltransferase) reporter activity using an enzyme-linked immunosorbent assay (n=4). (c) Immunoblot analysis of Iron-regulatory protein-1 (IRP1) and IRP2 protein expression in response to increasing Mn concentrations. β-actin served as loading control (n=3). Data shown represent mean ± SD. N number indicates number of replicates. Differences were calculated using two-way ANOVA (a) or unpaired t-test (b, c) (*, p < 0.05; **, p < 0.01).

