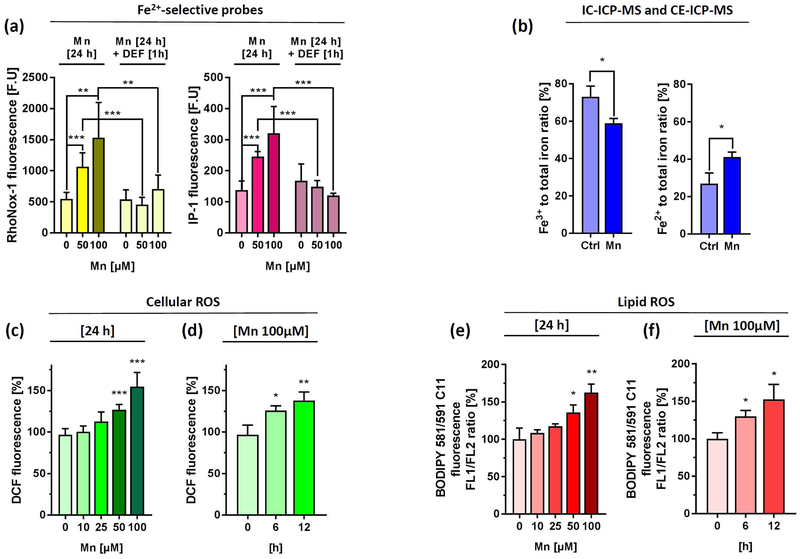
Figure 4. Mn treatment increases labile iron pool (LIP), cytoplasmic and lipid ROS levels in a concentration and time-dependent manner.
(a) SH-SY5Y cells were incubated for 24 h with indicated Mn concentrations and incubated with either 5 µM RhoNox-1 dye for 1 h (left panel) or 20 µM IP-1dye for 2h (right panel). As additional control Mn treated wells were incubated with 100 µM of the iron chelator Deferiprone (DEF) for 1 h and incubated with both dyes. Fluorescence was presented as absolute fluorescence units (F.U.) (n=6). Cell-free fluorescence intensities of both Fe2+-selective dyes ± 100 µM Mn in OpiMEM were shown in Supplemental Fig. 3b. (b) IC-ICP-MS and CE-ICP-MS analysis were performed to determine Fe3+ and Fe2+ levels in RIPA lysates from SH-SY5Y incubated with DMEM media alone or 100 µM Mn for 24 h. Data are presented as Fe3+ and Fe2+ to total iron (Fe3+ and Fe2+) ratio (n=3). Absolute Fe3+ and Fe2+ values are presented in Supplemental Fig. 3c. (c) SH-SY5Y cells treated with increasing Mn concentrations for 24 h and analyzed for cellular oxidative stress levels via DCF fluorescence using flow cytometry. Mean relative fluorescence intensity (RFI) was presented as % increase to untreated controls (n=3). (d) SH-SY5Y cells treated with 100 µM Mn for indicated time points and analyzed for DCF fluorescence (n=3). (e) In a similar fashion lipid ROS was determined using the fluorescence dye BODIPY-C11 and flow cytometry after Mn treatment with increasing concentrations for 24 h (f) or 100 µM Mn for indicated time points. Mean relative fluorescence intensity of DCF and FL1/FL2 ratio of BODIPY-C11 were presented as % increase to untreated controls (n=3). Data shown represent mean ± SD. N number indicates number of replicates. Differences were calculated using unpaired t-test (*, p < 0.05; **, p < 0.01).

