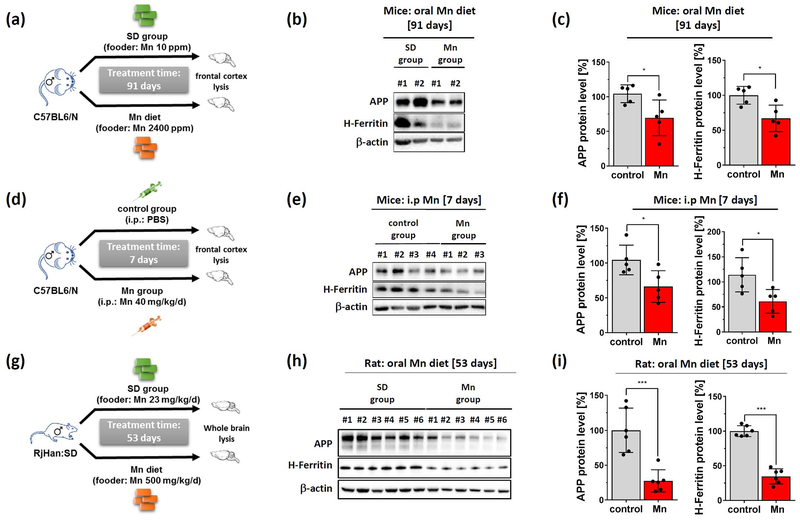
Figure 6: Dietary Mn suppresses APP and H-Ferritin protein expression in vivo and inversely correlates with redox-active Fe2+ levels.
(a) Mice were orally treated with standard diet (control group: 10 p.p.m Mn) or high Mn diet (Mn group: 2400 p.p.m Mn) for 91 days. (b) Explanted cortices were analyzed for APP (clone A8717) and H-Ferritin (ab137758). β-actin (clone AC-15) served as loading control. (c) Relative protein levels were measured by densitometry and normalized to β-actin (each group: n=5). (d) Mice were either i.p. injected with PBS (control group) or with MnCl2 (40 mg/kg/day) for 7 days. (e) Cortices were blotted for APP (clone A8717) and H-Ferritin (ab137758). β-actin served as loading control. (f) Relative protein levels were measured by densitometry and normalized to β-actin (each group: n=5). (g) Sprague-Dawley rats were orally treatment with Mn (500 mg/kg) or with standard diet for 53 days. (h) Harvested whole brain lysates were blotted for rat APP (clone 22C11) and H-Ferritin (clone D1D4). β-actin served as loading control. (i) Densitometric quantification of APP and H-Ferritin were normalized to β-actin (each group: n=6). Representative western blots of IRP1, IRP2, Beclin-1 and LC3 are shown in Supplemental Fig. 5. Data are presented as mean ± SD. N number indicates number of individual animals. Differences were calculated by unpaired t-test (*, p<0.05; **, p<0.01).

