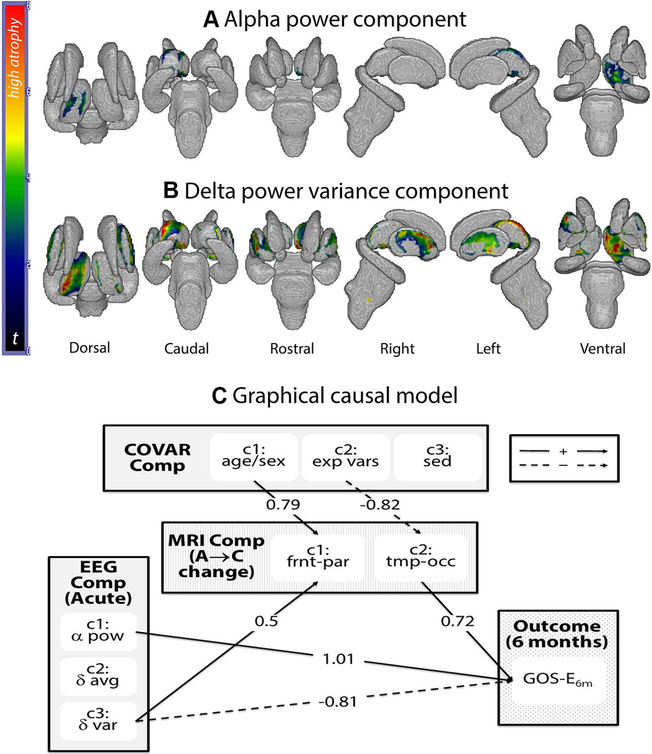
Figure 1.
(A) Regions in which the degree of atrophy is significantly (negatively) related to the alpha power electroencephalography (EEG) component. (B) Regions in which the degree of atrophy is significantly (positively) related to the delta power variance components. (C) Graphical causal model: significant paths, with associated parameter estimate value, for the graphical causal model (see online supplementary efigure 2 for model specification). Bold arrows indicate paths with positive parameter estimate value, while dashed arrows indicate paths with negative parameter estimate value. α pow, alpha power component; δ avg, delta power average component; δ var, delta power variance component; A → C, acute to chronic change; COVAR comp, covariate components; exp vars, experimental variables component; frnt-par, frontoparietal component; GOS-E6m, Glasgow Outcome Scale—Extended at 6-month follow-up; sed, sedation component; tmp-occ, temporo-occipital component.

