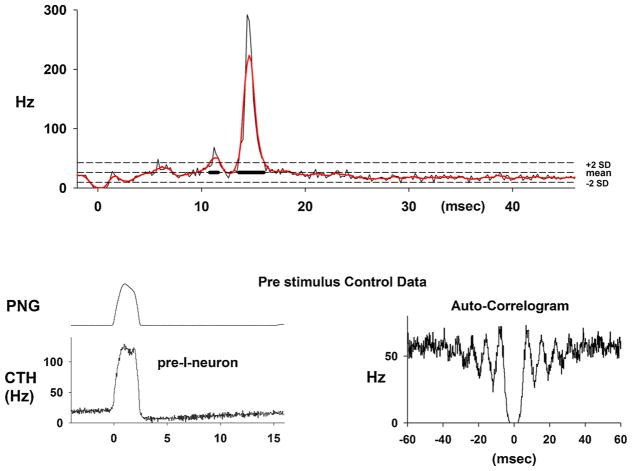
Fig. 6.
Upper: An example of a PSTH of the activity from a pre-I neuron that shows a very marked increase in the probability of firing with a latency of ~13-ms. The respiratory cycle-triggered histogram (lower left) shows a ramp increase in activity during the E-phase before the I burst activity. The auto-correlogram indicates that the data represent the activity of a single neuron, since there is no activity close to the zero time from other neurons.

