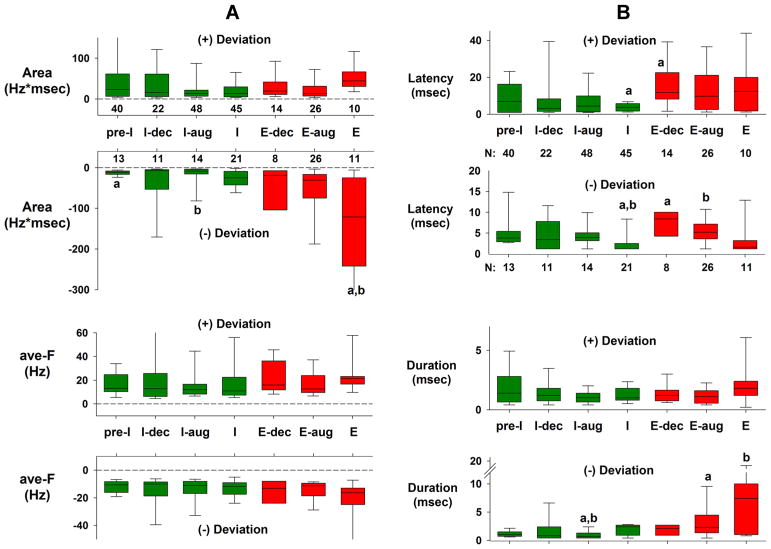
Fig. 9.
Group data for the largest significant positive (+) and/or negative (−) deviations for each subtype of medullary neuron. A) Data for the Area parameter (upper) and average deviation frequency (ave-F, lower). The size of the bars reffects the magnitude of the synaptic input. B) Data for the deviation latency (upper) and duration (lower). Green bars: data for I-neurons; red bars data for E-neurons. Numbers below or above the upper bar graphs indicate the number of neurons having positive and negative significant deviations. Significant differences (one-way ANOVA on ranks) between the bars are indicated by lower case a and b symbols. Note that the Areas for the (−) deviations of the E-neurons are clearly larger than those for the I-neurons, mainly due to the larger durations (B, bottom), while ave-F was not different among the groups. See text for details.

