
Fig. 1.
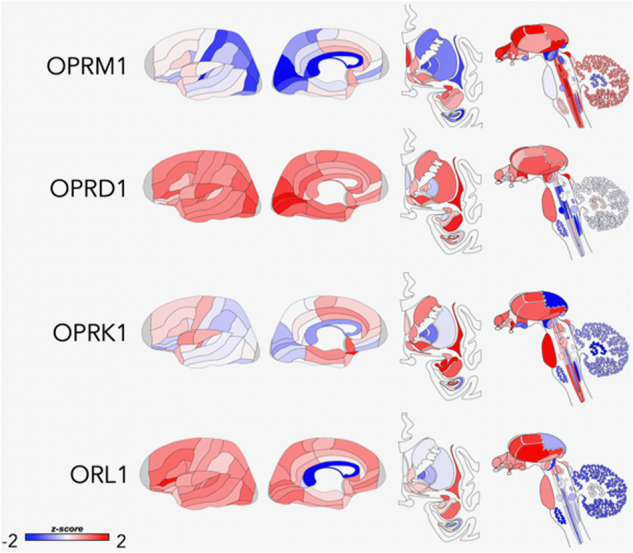
Areas of opioid receptor gene expression (μ = OPRM1; δ = OPRD1; κ = OPRK1; NOP = ORL1) in the human brain (Donor: H0351.1015, 55 yrs, Male, White or Caucasian). The cortical gene expression patterns are displayed on an inflated cortical surface (outer and inner surfaces of the left hemisphere). Subcortical structures of the brain are represented from the frontal view, and subcortical as well as brainstem structures are shown in the side view. The color bar displays expression values using z-score normalization. Allen Institute; http://www.brain-map.org