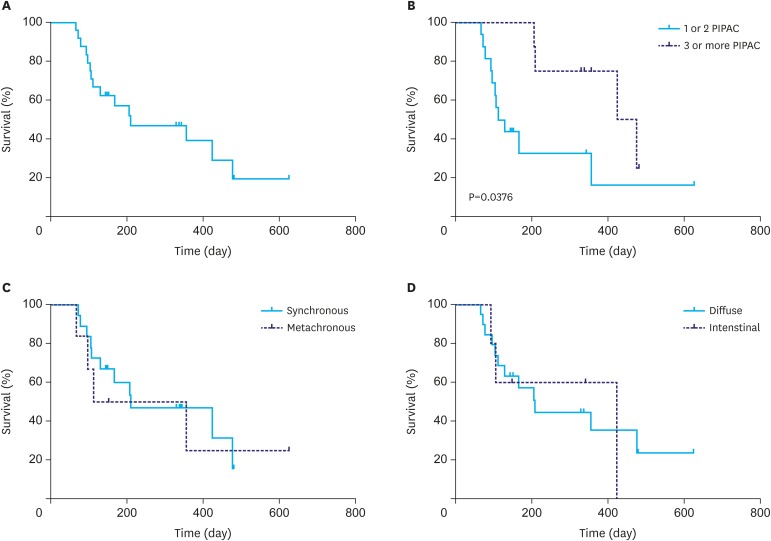
Fig. 4. Survival curves. (A) Kaplan-Meier survival curves of all 24 patients treated by PIPAC, (B) stratification of patients, who received 1 or 2 PIPACs (16) vs. 3 or more PIPACs (8; P=0.0376), (C) metachronous (6) vs. synchronous (18) PM, and (D) diffuse (19) vs. intestinal (5) type of GC according to Laurén's classification (Log-Rank [Mantel-Cox] test).
PIPAC = pressurized intraperitoneal aerosol chemotherapy; PM = peritoneal metastasis; GC = gastric cancer.

