Fig. 5.
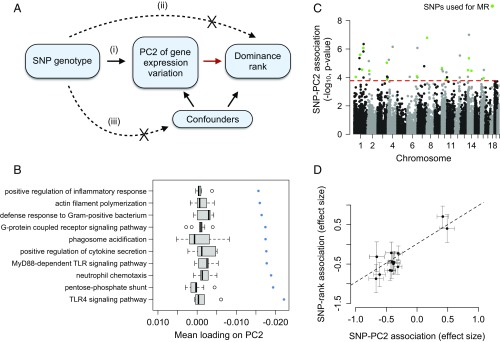
Changes in gene expression precede social status attainment in male baboons. (A) MR can be used to test the hypothesis, highlighted with a red arrow, that PC2 of gene expression variation (treated here as a measure of quality or condition) is causal to dominance rank. This test is robust provided that the following assumptions are met: (i) SNP genotype (the instrument) is a strong predictor of gene expression PC2, (ii) SNP genotype has no association with dominance rank except through its effects on gene expression, and (iii) SNP genotype is not related to confounding factors. (B and C) Graphs show that assumption (i) is satisfied. We see no detectable relationship between SNP and rank for these variants independent of PC2, satisfying assumption (ii). (B) Genes that load highly on PC2 tend to be involved in innate immune signaling pathways. The x axis represents the mean PC2 loading for genes in the GO category represented on the y axis. Blue points represent observed data, and gray boxplots represent mean loadings for each GO category after randomizing genes across categories (while maintaining the same number of genes in each category). (C) Manhattan plot showing the strength of the association (−log10 P value) between SNP genotype and PC2 for all SNPs tested (n = 39,461 candidate SNPs). Green points represent SNPs that passed all filtering criteria and were used as instruments in MR analyses. The red dashed line represents the genome-wide significance cutoff (5% FDR) (65). (D) Intuitively, if gene expression is causal to dominance rank, individuals with genotypes that predispose them toward low PC2 gene expression values should tend to also be of high rank (low PC2 values are associated with high social status; Fig. 1). Consistent with this idea, effect sizes for the relationship between the SNP and PC2 consistently predict effect sizes for the SNP/dominance rank relationship (MR Egger method: β = 1.2284, P = 4.54 × 10⁻³).

