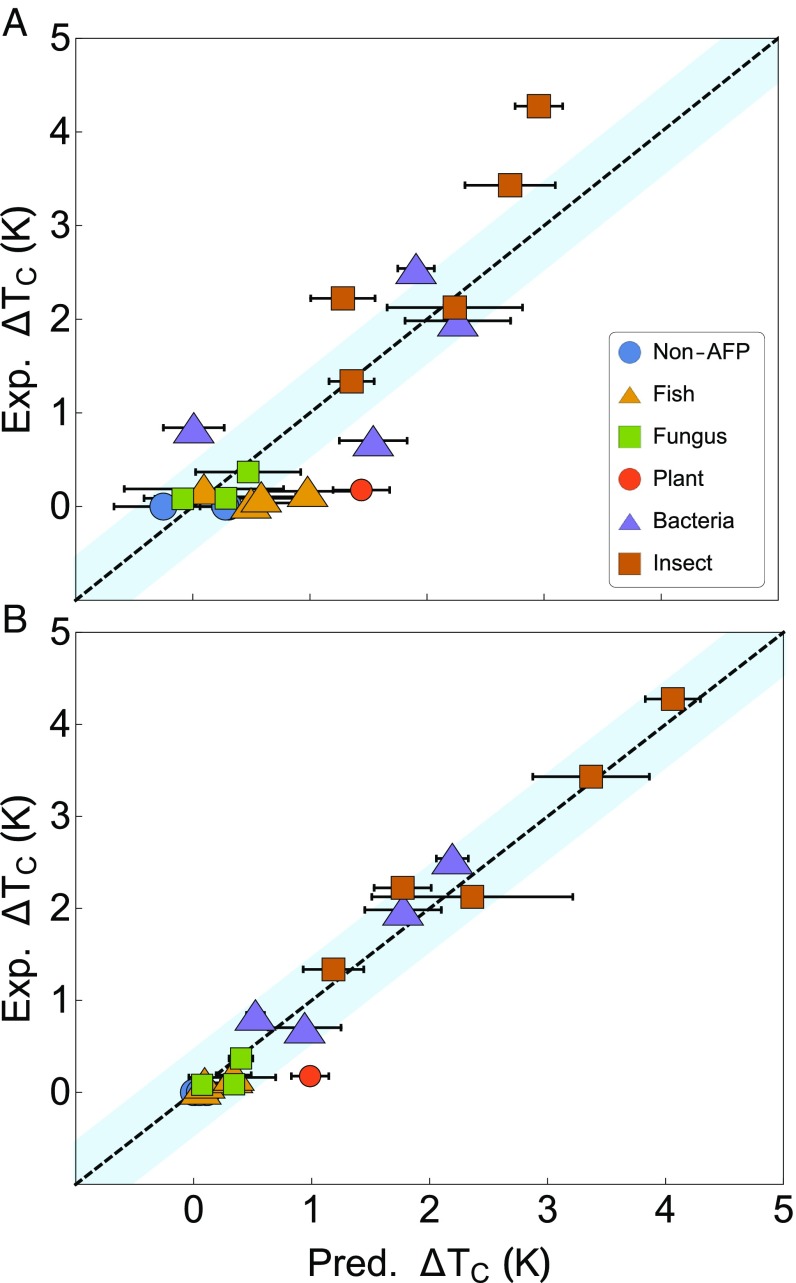
Fig. 3.
values predicted (Pred.) by (A) LM and (B) NN compared with values from experimental (Exp.) data in Table 1. Dashed lines are y = x, and the blue regions represent an error of K. Error bars represent one SD in the predicted value. Error is a result of uncertainty in the measured variables due to thermal motion.

