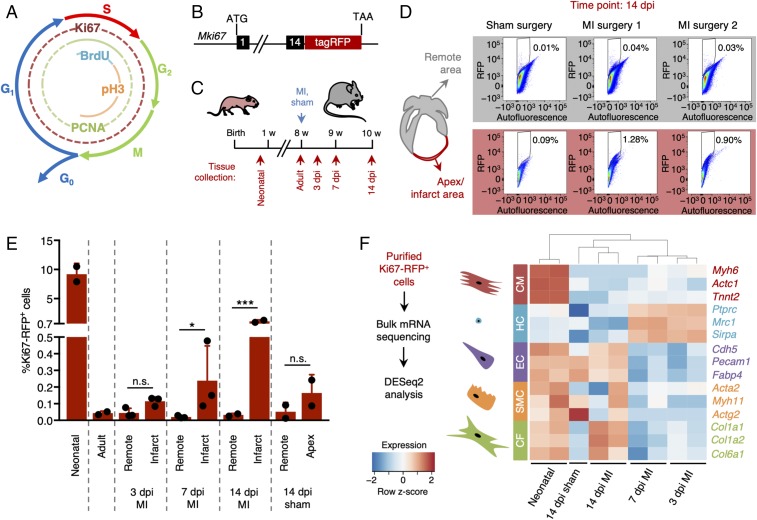
Fig. 1.
Quantification and characterization of cardiac cell proliferation following injury. (A) Diagram showing the markers of the different phases of the cell cycle. (B) Schematic representation of the reporter mouse model expressing RFP-tagged Ki67 (Mki67TagRFP). (C) Experimental timeline of myocardial infarction (MI) surgery and tissue collection 3, 7, and 14 d post-MI injury (dpi). (D and E) Quantification of Ki67-RFP+ cells after MI or sham surgery in both remote (gray) and infarcted zone (red). The gating and sorting strategies are described in SI Appendix, Fig. S1. (D) Representative flow cytometry scatter plots 14 dpi. (E) Quantification of Ki67-RFP+ cells in neonatal, adult, infarct, remote and apex areas 3, 7, and 14 dpi (n = 2–3 mice per condition). All error bars represent ±SD. Asterisks indicate significance (Student’s t test: n.s., not significant, P ≥ 0.05; *P < 0.05; ***P < 0.001). (F) Bulk mRNA sequencing strategy and gene expression levels of different cardiac cell types identified in the purified Ki67-RFP+ populations. Cardiomyocytes were enriched in neonatal hearts. Hematopoietic cells were enriched 3 and 7 dpi, while resident lineages such as endothelial cells and fibroblasts were more abundant 14 dpi. CF, cardiac fibroblasts; CM, cardiomyocytes; EC, endothelial cells; HC, hematopoietic cells; SMC, smooth muscle cells.

