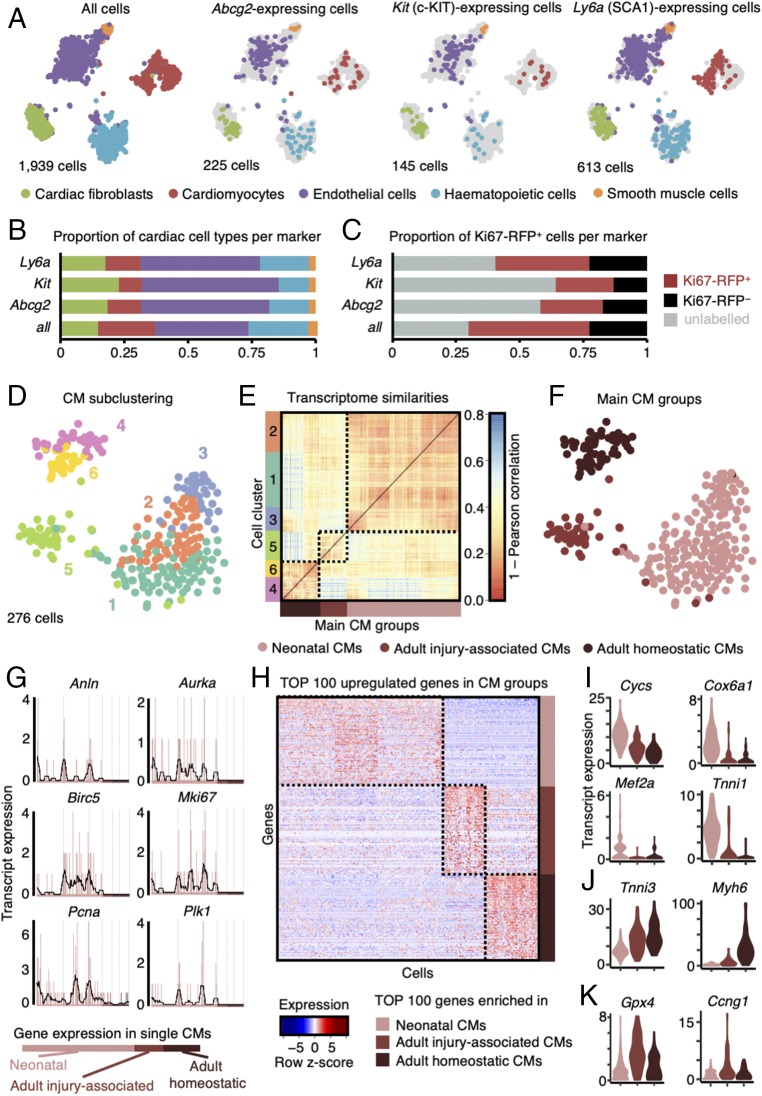
Fig. 3.
Expression patterns of putative CSC markers and cardiomyocytes. (A) t-SNE map displaying stem cell marker (Abcg2, Kit, and Ly6a) expressing cells in major cell type clusters; CF, cardiac fibroblasts; CM, cardiomyocytes; EC, endothelial cells; HC, hematopoietic cells; SMC, smooth muscle cells. (B) Quantification of marker-based cell fraction per cell type reveals most stem cell markers cover endothelial cells but can be found in all resident populations. (C) Quantification of marker-based cell fraction in sorted populations (unlabeled, Ki67-RFP+, and Ki67-RFP−). (D) t-SNE map of cardiomyocyte subclusters (n = 6) identified using the RaceID2 algorithm. (E) Heatmap representation of the transcriptome similarities between cardiomyocytes from the six identified subclusters combined into three main groups of cardiomyocytes. (F) t-SNE map highlighting the cells assigned to each of the three main groups of cardiomyocyte subclusters. (G) Expression profile of representative proliferation markers in neonatal and adult (homoeostatic or injury-associated) cardiomyocytes. Gene expression is shown on the y axis as transcript counts per cell on x axis with the running mean in black. (H) Heatmap representation of top 100 up-regulated genes in neonatal and adult (homoeostatic or injury-associated) cardiomyocytes. (I–K) Violin plots showing the expression of representative genes up-regulated in neonatal cardiomyocytes (I), adult homoeostatic cardiomyocytes (J), and adult injury-associated cardiomyocytes (K).

