Fig. 3.
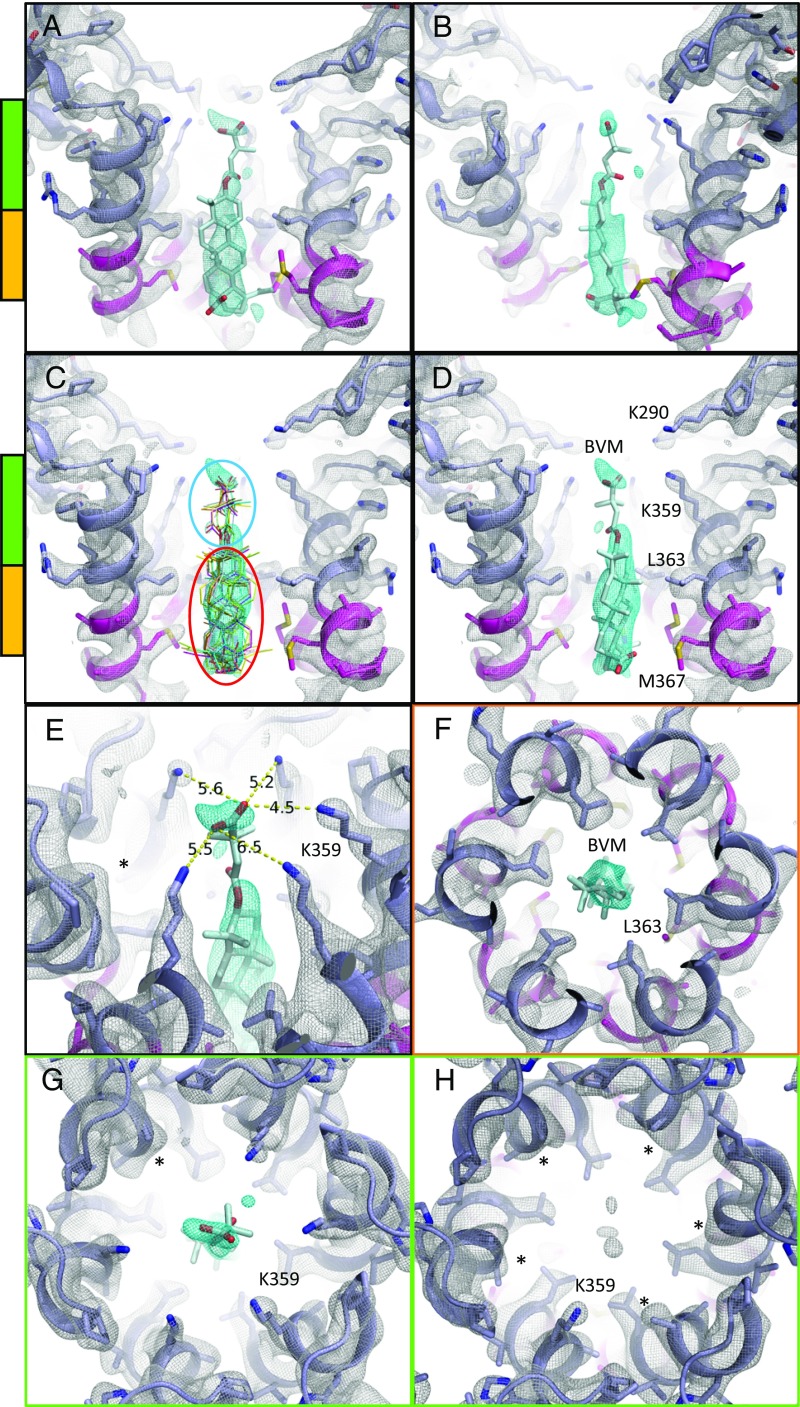
MicroED map of CTD-SP1-BVM suggests a mode of drug binding. CTD-SP1-BVM map contoured at 1.2σ above the mean (a single map is shown with protein density colored white and BVM density in cyan). Green and orange bars indicate the axial positions shown in F–H. BVM was never included in the model used for map calculation. (A) En face and (B) profile views of BVM density within the six-helix bundle formed at the junction of CTD (slate blue) and SP1 (magenta). (C) Eleven BVM conformers (48) docked into the map show that the rigid pentacyclic triterpenoid (red ellipse) fits well into the primary drug density, while the terminal carboxyl of each conformer fits within the satellite peak. Flexibility of the dimethylsuccinyl group (blue ellipse) is likely responsible for the break between the primary and satellite drug densities. (D) A single BVM conformer shows that drug binding spans the length of the junction helices and positions the dimethylsuccinyl carboxyl at the center of the K359 ring of lysines. (E) The K359 side chain densities and B factors vary among the protomers, supporting a preferred BVM binding pose with associated, specific K359 interactions. The side chain of one K359 (*) was not modeled due to a complete lack of density. (F) L363 of the CTD-SP1 protease cleavage site contributes the preponderance of hydrophobic interactions with BVM. The opposite axial orientation (BVM-down) leaves the satellite peak unoccupied and positions the C-28 carboxyl of the pentacyclic triterpenoid distant from K359 (Fig. 4B). (G) Axial view of the BVM binding site showing density for five of six K359 side chains near the terminal BVM carboxylic acid. (H) Axial view of drug-free CTD-SP1 showing the absence of density for five of six K359 side chains.

