Fig. 5.
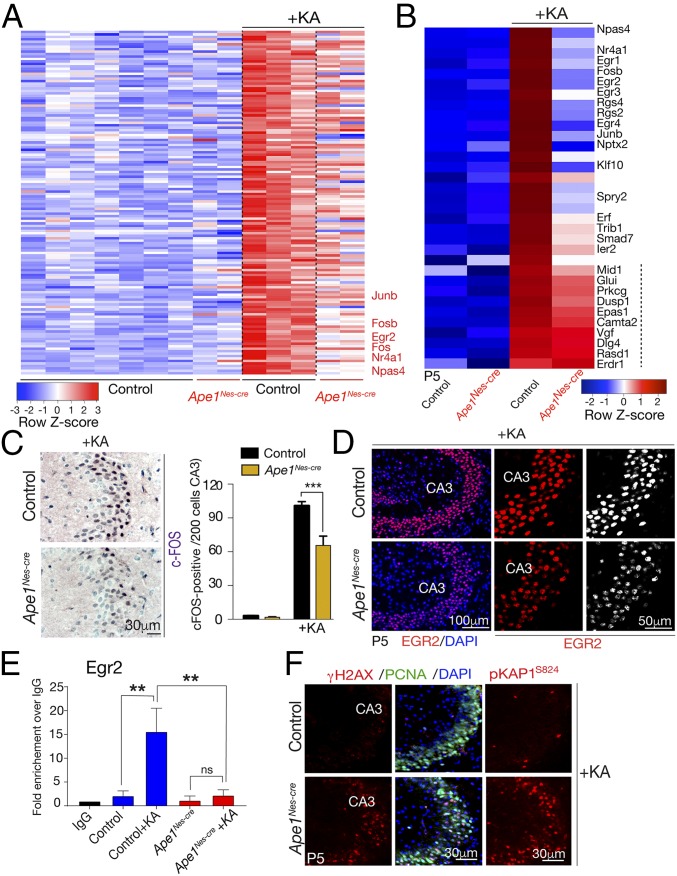
APE1 regulates a subset of IEGs in response to excitotoxic stimulation. (A) A heatmap depicting microarray expression analysis shows that after KA treatment a subset of genes that are markedly up-regulated in the control hippocampal formation are reduced in expression in Ape1Nes-cre tissue. Genes listed in red text are IEGs (a full gene set list is presented in SI Appendix, Table S1). The color bar indicates relative gene-expression levels depicted in the heatmap. (B) Analysis of selected IEGs shows that many of these are decreased in Ape1Nes-cre tissue compared with control tissue. Genes displayed were based on differences in expression between WT tissue after KA treatment and Ape1Nes-cre tissue after KA treatment, with the smallest difference on the bottom and the largest difference at the top. In comparison with IEGs, other genes (marked by the dashed line) show similar expression in control tissue after KA treatment. (C, Left) Immunohistochemical identification of c-FOS after KA treatment shows reduced up-regulation in the Ape1Nes-cre hippocampal region compared with control tissue. (Right) The graph shows the quantification of c-FOS+ cells (of 200 counted cells), showing an ∼35% reduction in levels; ***P < 0.001. (D) Immunostaining indicates the reduction of EGR2 after KA stimulation in the Ape1Nes-cre hippocampal region compared with the control tissue. CA3, cornu ammonis 3 region of the hippocampal formation. (E) ChIP shows reduced AP-1 (JunB) occupancy at the Egr2 promoter in Ape1Nes-cre tissue 1.5 h after KA exposure. n.s., not significant, **P < 0.001. (F) KA treatment induces extensive DNA-strand breaks in the hippocampus as determined using γH2AX and phosphorylation of KAP1 (at serine 824).

