Fig. 4.
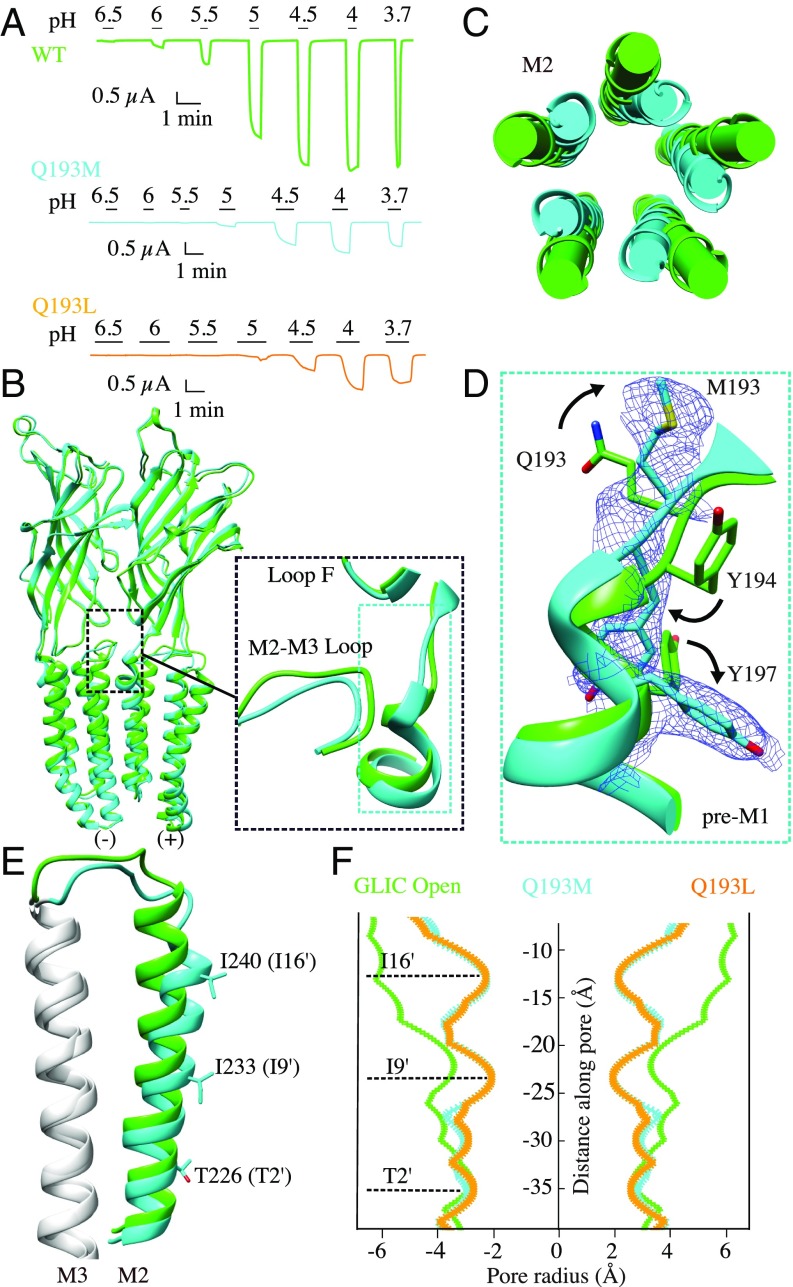
Characterization of GLIC Q193M and Q193L mutations. (A) Proton-elicited currents from GLIC wild-type (green), Q193M (cyan), and Q193L (orange). (B) Structural superimposition of the GLIC Q193M (cyan) with the open form of wild-type GLIC (green). Only two subunits are shown viewed from the outside of the pentamer. Both structures are aligned using the whole pentamer. Inset shows an enlarged view of the pre-M1 region and of the M2-M3 loop reorganization. (C) Top view of the conformational change of M2 helices. (D) Conformational rearrangement of the pre-M1 region. The electron density of the 2mFo-DFc map around Q193M (blue) is contoured at the level of 1 σ. (E) Side view of the conformational change of the M2 helix, M2-M3 loop, and M3 helix from one subunit. (F) Pore-radius profile for GLIC WT open (green), Q193M (cyan), Q193L (orange). The constriction sites in the LC conformation from M2 helix are labeled and are shown as sticks in E.

