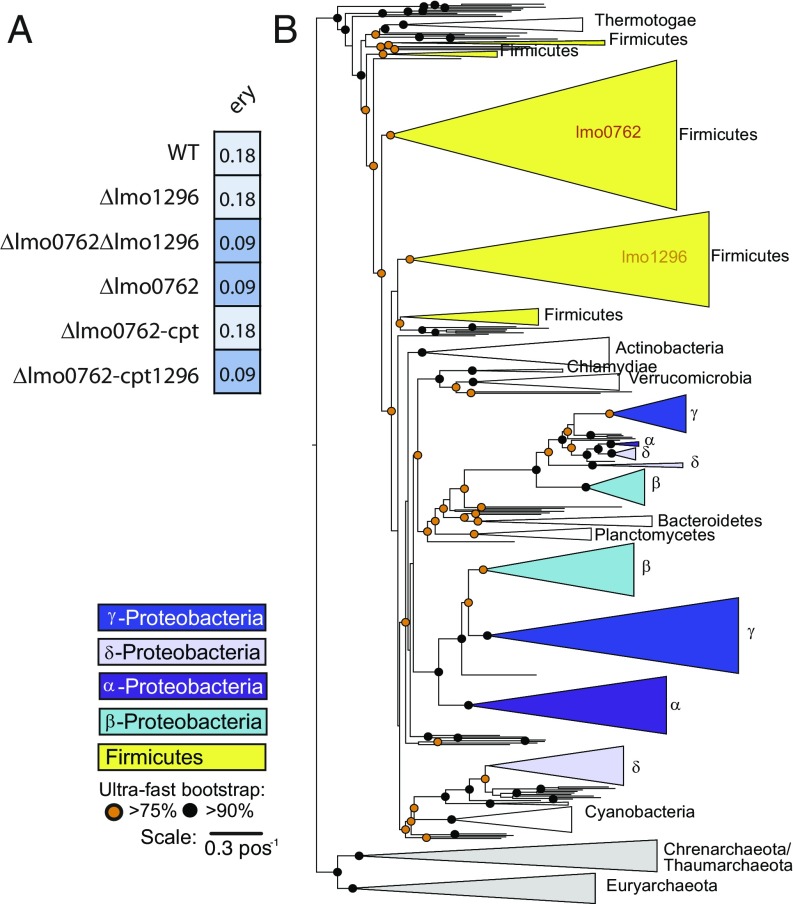
Fig. 2.
Phylogeny of HflX homologs. (A) Schematic representation of MIC assays, similar to Fig. 1C. (B) Schematic representation of the phylogenetic tree of hflX homologs among prokaryotes. A detailed tree is available in SI Appendix, Figs. S4 and S5.

