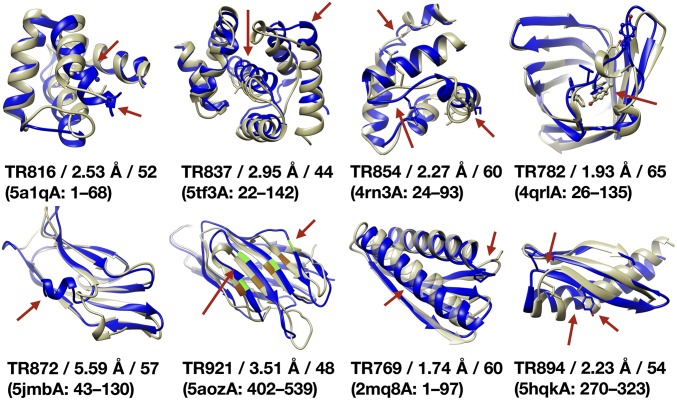
Fig. 1.
Protein test set. Experimental structures (yellow) and homology models (blue) with CASP ID, PDB ID of the experimental structure, residue ranges, and deviations in Cα-RMSD and GDT-HA. Red arrows and stick representations identify modeling errors and key residues. For TR921, the highlighted residues M66, N75, D40, and E119 indicate alignment errors.

