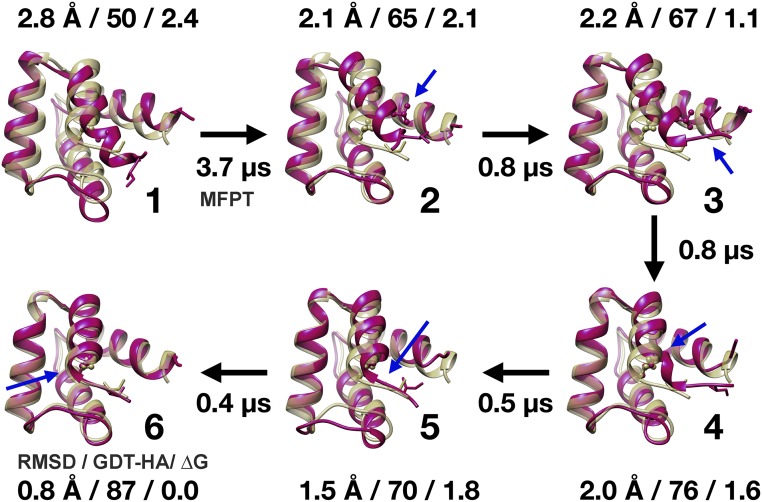
Fig. 3.
Refinement path transition in TR816. Ensemble-averaged structures for MSM states during refinement transitions (magenta) are compared with experimental structures (yellow) for one of two paths. The alternative path is shown in SI Appendix, Fig. S6. The numbering of states corresponds to the states identified in Fig. 2. Cα-RMSD values, GDT-HA scores, and free energies in kilocalories per mole are given for each state, and mean first passage times (MFPT) refer to transitions toward the native state. Blue arrows indicate key structural changes after each transition.

