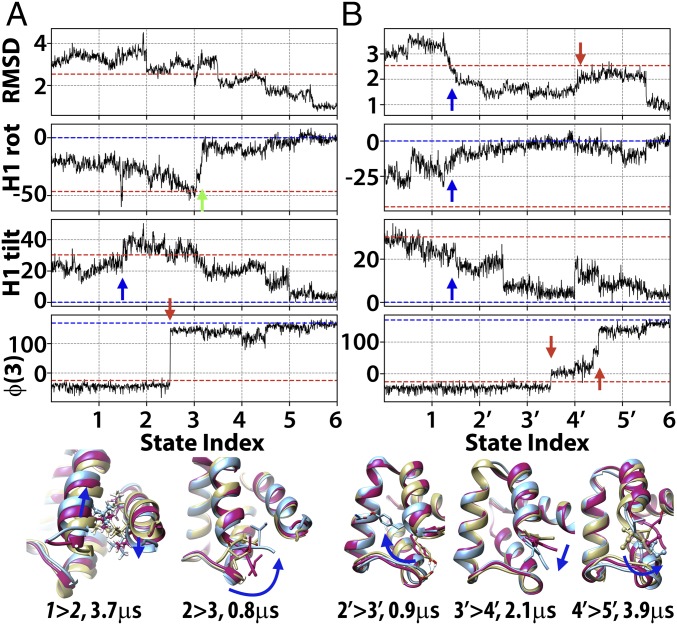
Fig. 4.
Structural transitions during refinement of TR816. Progress in terms of Cα-RMSD, rotation, and tilt angles of the N-terminal helix (H1, residues 4 to 15) with respect to the experimental structure, and φ backbone torsion for residue 3 along subsampled refinement trajectories. Two alternative paths are shown in A and B along states numbered as in Figs. 2 and 3. Key transitions are indicated with arrows. Dashed lines show values in the experimental structure (blue) and the initial homology model (red). Selected transition states are shown in molecular detail (magenta) with structures before (yellow) and after (blue). Colored arrows are referred to in Kinetics of Transitions from Initial to Native States. Additional details are shown in SI Appendix, Fig. S13.

