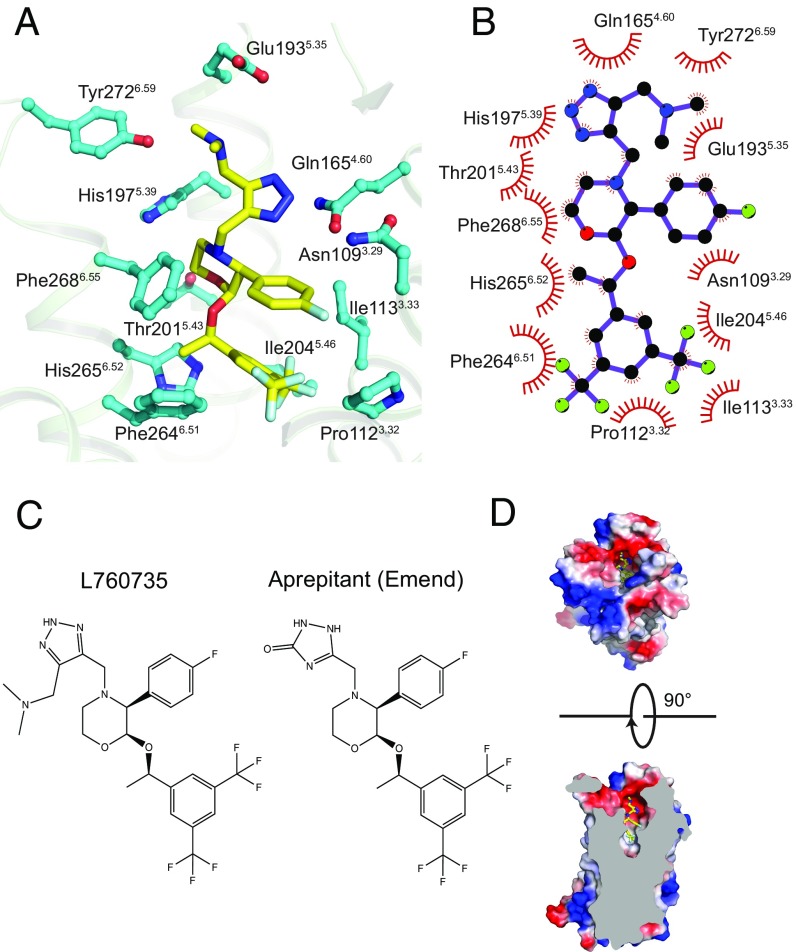
Fig. 3.
L760735 interaction with hNK1R. (A) All residues within 4 Å of L760735 are depicted with cyan carbons. (B) Two-dimensional schematic of contacts between L760735 and hNK1R, produced in Ligplot (65); (C) Chemical structures of aprepitant and L760735. (D, Top) Extracellular view, receptor surface is colored according to electrostatic potential. (D, Bottom) Side view, cut through the receptor.

