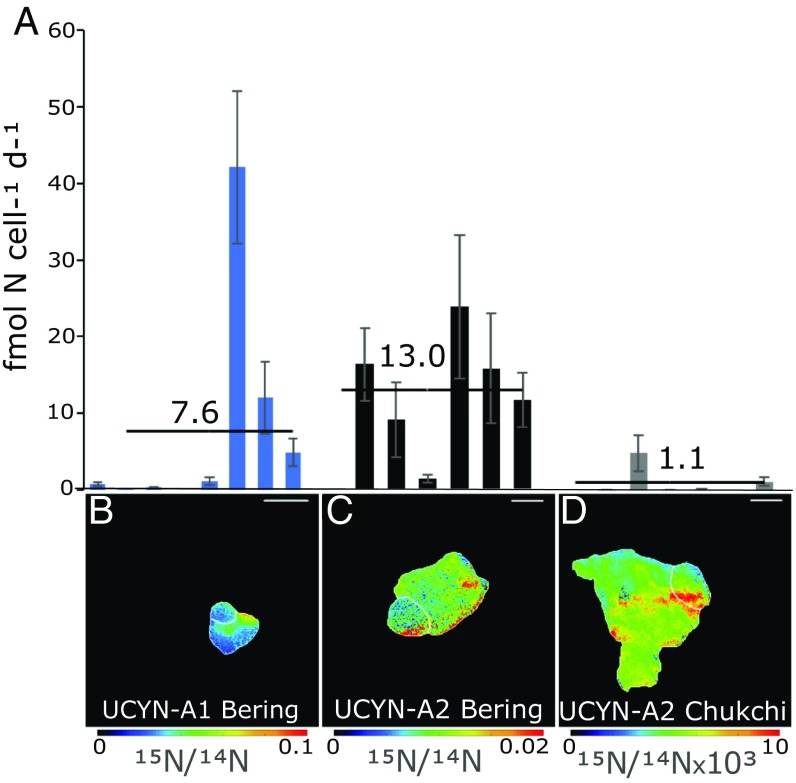
Fig. 4.
UCYN-A symbioses fix 15N2 in western Arctic waters. UCYN-A cell-specific 15N2 fixation rates (A) and 15N enrichment (B–D) from nanoSIMS measurements after incubating natural populations in seawater with 15N2. Bars of the same color (A) represent rates measured in individual symbioses (UCYN-A with host alga) from a single station and lineage (noted in underlying cell image). (Scale bar, 2 µm.) Averages are shown by a horizontal black line. Error bars are the SD of the cell-specific rate between the host and UCYN-A. Note the colored axes differ in scale on nanoSIMS images (B–D).

