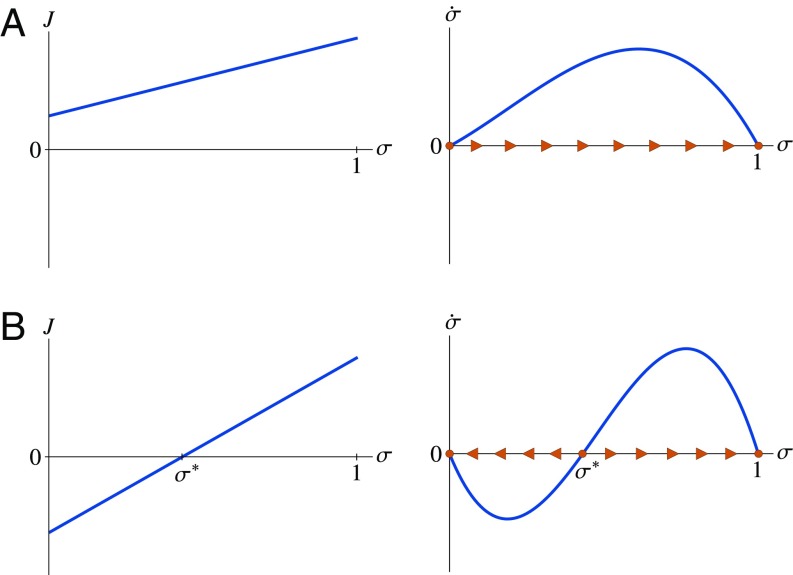
Fig. 1.
Population dynamics of a scientific field, depending on its power (), significance (), and homophilous bias (). (A and B, Left) Graphs display [2], which relates the Youden index () to the share of Better scientists in the tenured population (). (A and B, Right) Graphs are phase lines for [5], which describes how the share of Better scientists () evolves over time. (A) High power: . When a science has high power, the Better paradigm necessarily prevails. (B) Low power: . When a science has low power, the Worse paradigm may prevail; this happens when many scientists initially believe in the Worse paradigm [].

