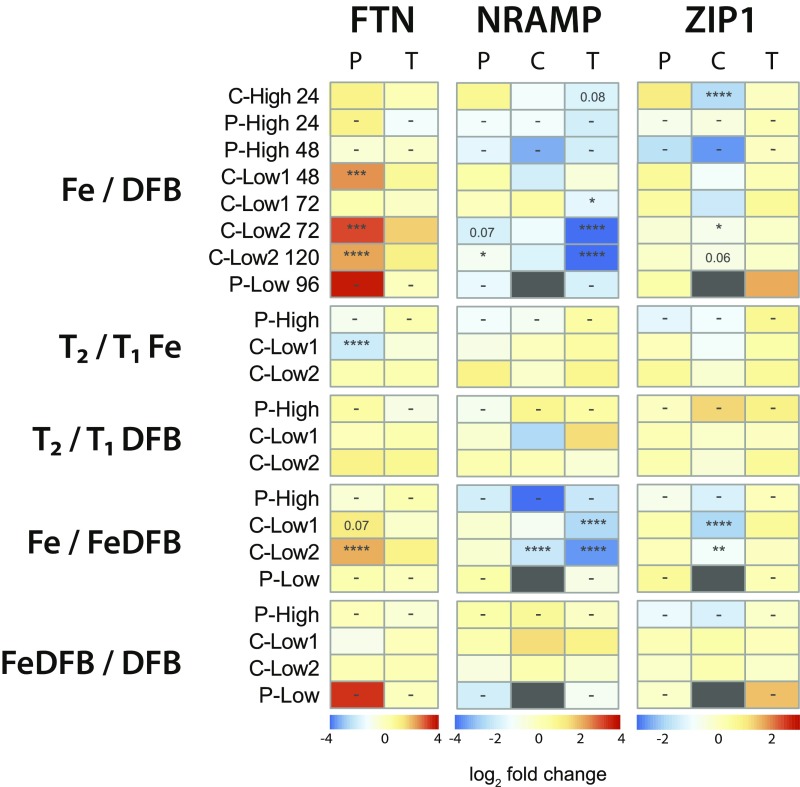
Fig. 6.
Heatmap of log2 fold-change values for ferritin (FTN), natural resistance-associated macrophage protein (NRAMP), and ZIP1 expression in Pseudo-nitzschia (P), Chaetoceros (C), and Thalassiosira (T). Comparisons are separated into five groups in order from Top to Bottom: iron addition (Fe) vs. iron removal (DFB), T2 Fe vs. T1 Fe, T2 DFB vs. T1 DFB, iron addition and then removal (FeDFB) vs. Fe, and FeDFB vs. DFB. Dark gray indicates that the gene was not detected in both samples being compared. Significance in differential expression is shown within each cell where applicable (displayed numerically, P 0.1; *P 0.05; **P 0.01; ***P 0.001; ****P 0.0001; −, not applicable).

