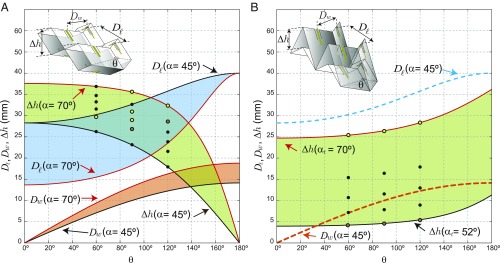
Fig. 3.
Relation between folding angle and dipole distances , , and for the mirror stack and inline stack of the Miura-FSS. (A) For the mirror stacking of identical layers, the shades represent the range of the curves for panel angles between and . The green, blue, and orange shades represent how , , and , respectively, vary with respect to . (B) For the inline stacking, the green shade represents the variation of for panel angles (subscript refers to the top layer) between and . The blue and orange dashed lines represent the distances and between the dipoles of the top and bottom layers. In both A and B, the yellow circles represent the configurations in which percentage bandwidth is (comparable to single-layer Miura-FSS) while black circles represent configurations which can realize broader bandwidth (), and brown circles represent configurations with multiband and multiresonant frequency.

