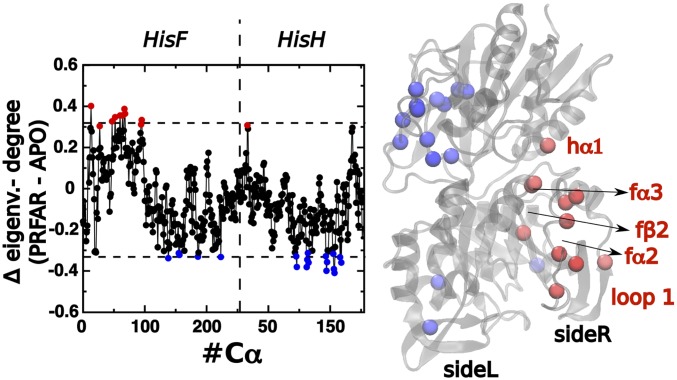
Fig. 6.
Difference between EC and DC, , for the PRFAR-binding process (PRFAR-bound – apo) for an exponential damping of Å as a function or the residue index (Left) and plotted on top of the protein representation (Right). Red and blue values are regions that, respectively, gain and lose correlation with central amino acids upon PRFAR binding. The domains with higher PRFAR-induced increase are labeled.

