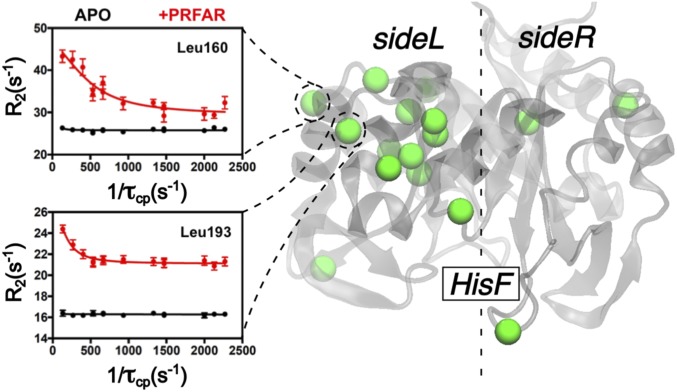
Fig. 9.
NMR relaxation dispersion experiments characterizing the PRFAR-induced millisecond motions in the HisF subunit of IGPS. Right highlights the residues that show the highest variation on their relaxation-dispersion profile upon PRFAR binding. Left shows two representative relaxation dispersion curves for residues Leu160 (Upper) and Leu193 (Lower) in the apo and PRFAR-bound states (black and red, respectively).

