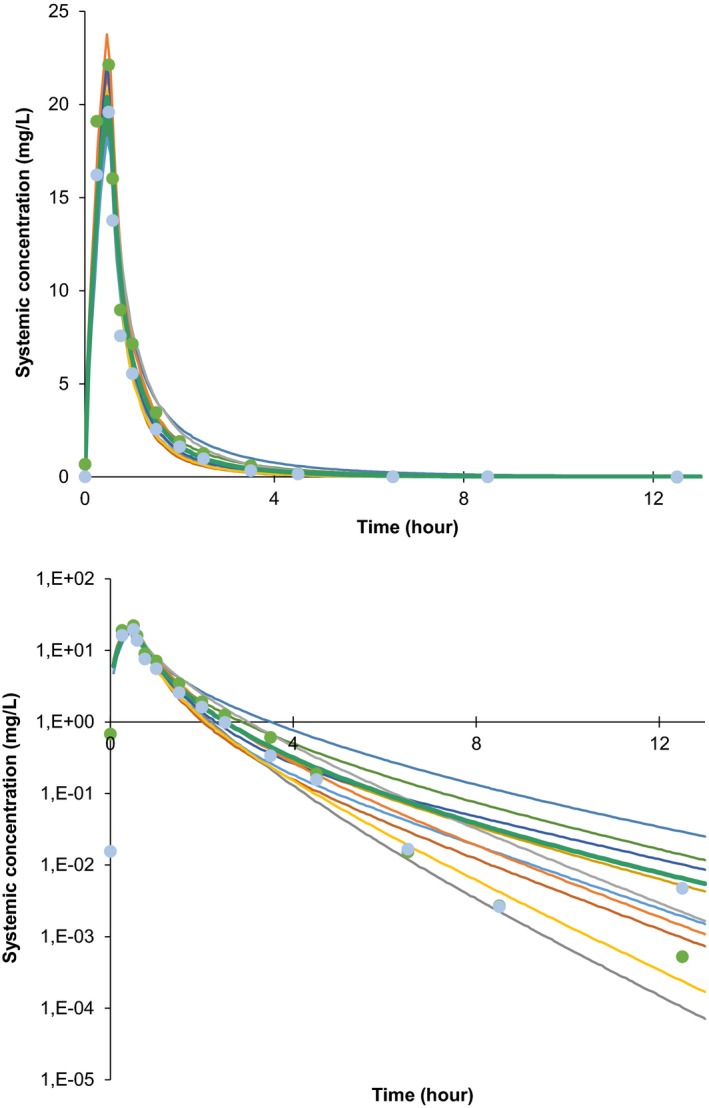
Figure 1.

Final compound model simulations: Simulated (lines) and observed (dots) mean plasma concentration‐time profiles of evofosfamide given as intravenous infusion of 480 mg/m2 over 30 minutes. Ten trials of 22 subjects each were simulated; the lines reflect the means for each trial. The two sets of observed clinical data plotted reflect the measured values after the first (green dots) and third infusion (light blue dots), respectively. The graphs show the data on linear (top) and semi‐logarithmic scale (bottom). For comparison, 2.5 μM (used as half‐maximal induction of cytochrome P450 (CYP)3A induction) corresponds to 1.12 mg/L.
